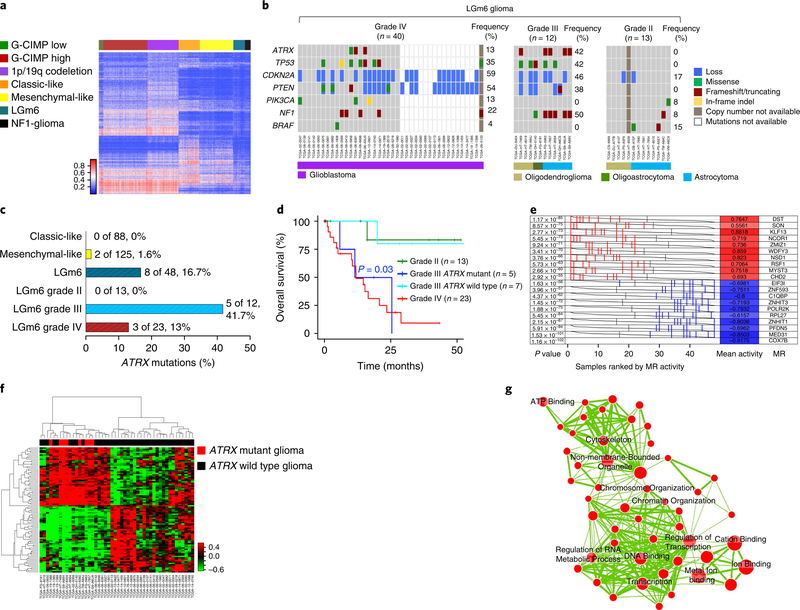
Fig. 6 |. NF1-gliomas resemble LGm6 subgroup of sporadic gliomas.
a, Heat map of DNA methylation data for the TCGA pan-glioma cohort (n = 819) and 31 NFI-gliomas according to the methylation clusters of sporadic gliomas10. The methylation profiles of NFI-glioma samples were classified using a nearest neighbor classifier based on 1,233 cancer-specific DNA methylation probes. Thirty-one of 31 NFI-glioma samples were assigned to the LGm6 methylation cluster, one of the methylation clusters that includes both low-grade and high-grade gliomas. b, Oncoprint of selected somatic genomic alterations in the LGm6 group of gliomas from the TCGA data set (ATRX, TP53, CDKN2A, PTEN, PIK3CA, NF1, BRAF). Rows and columns represent genes and samples, respectively. Glioma grade was significantly associated with alterations of ATRX, TP53, CDKN2A, PTEN. Glioma grade IV, n = 40; glioma grade III, n = 12; glioma grade II, n = 13; P = 0.01, P = 0.02, P = 0.04, P = 0.002, respectively; two-sided Fisher’s exact test. c, Barplot of ATRX non-synonymous somatic mutations occurring in phenotypic subtypes of IDH wild-type gliomas (classic-like, mesenchymal-like, and LGm6) and LGm6 gliomas grouped by tumor grade. ATRX mutations were significantly enriched in grade III LGm6 (P = 0.01, two-sided Fisher’s exact test). d, Kaplan-Meier survival analysis of LGm6 gliomas stratified according to histological grade and ATRX status for grade III gliomas: grade II (green curve, n = 13), grade III ATRX mutant (blue curve, n = 5), grade III ATRX wild-type (cyan, n = 7), grade IV (red curve, n = 23). The ATRX mutant grade III subgroup showed a significantly worse survival when compared with ATRX wild-type grade III patients (P = 0.03, two-sided log rank test). No difference in clinical outcome was observed when comparing ATRX mutant grade III with grade IV. e, Master regulators (MRs) in ATRX mutant glioma. Gray curves represent the activity of each of the 10 MRs with the highest (red) or lowest (blue) activity. Red or blue lines indicate individual ATRX mutant samples displaying high or low activity, respectively, of the MRs in ATRX mutant compared with ATRX wild-type (n = 8 and n = 40 ATRX mutant and ATRX wild-type samples, respectively; P value, two-sided MWW test for differential activity (left) and mean of the activity (right)). f, Hierarchical clustering of MR activity in 48 high-grade LGm6 IDH wild-type gliomas (36 grade IV and 12 grade III). Data were obtained using the Euclidean distance and Ward linkage method built on differential activity of MRs in ATRX mutant (8 samples, red) versus ATRX wild-type (40 samples, black) tumors (two-sided MWW-GST q <0.01, absolute NES >0.6, and two-sided MWW test for differential activity P <0.01). The activity of 41 of 89 MRs was increased in ATRX mutant samples. g, Enrichment map network of statistically significant gene ontology categories (two-sided Fisher’s exact test q <0.01) for genes included in the regulons of the 10 MRs with the highest activity in ATRX mutant gliomas. Nodes represent gene ontology terms and lines their connectivity. Node size is proportional to number of genes in the gene ontology category and line thickness indicates the fraction of genes shared between groups.

