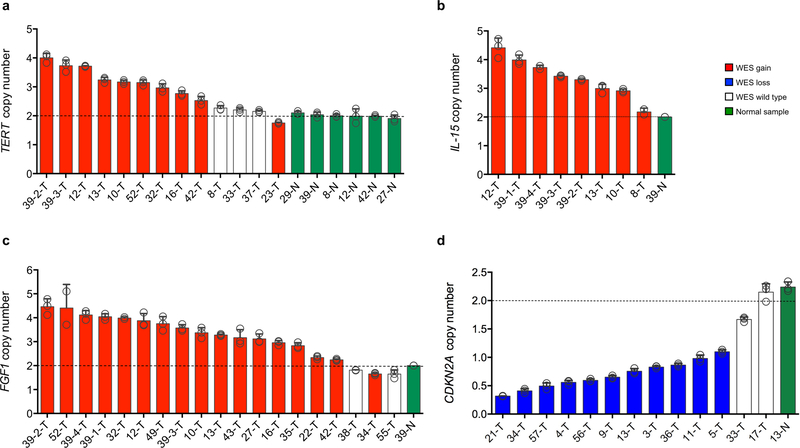
Extended Data Fig. 3 |. Validation of recurrent CNVs.
Genomic qPCR was performed to assay copy number changes for TERT (n = 10 glioma samples), b, IL-15 (n = 8 glioma samples), c, FGF1 (n = 17 glioma samples) and d, CDKN2A (n = 11 glioma samples). Red and blue bars indicate WES-inferred gene gain and loss, respectively. Analysis of normal DNA (green bars) was included to define diploidy (dotted line). Tumor samples diploid for the tested gene were included as control (white bars). Bar graphs show mean± s.d. of 3 technical replicates. Experiments were repeated three times with similar results.

