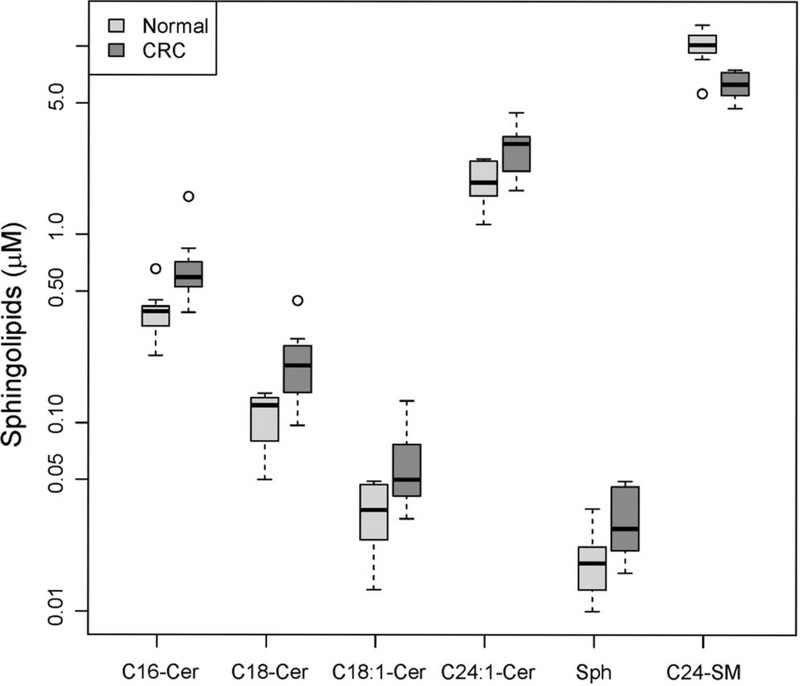
Figure 2.
The serum levels of five sphingolipids were found to be significantly different in patients with stage IV CRC (n=10) compared to controls (n=10). Data were log2-transformed (to improve normality) and modeled using a linear model. The significance of the group coefficient (CRC vs. control) was assessed via t-scores. p-Values were adjusted for multiple testing by using the false-discovery rate method to obtain q values. A value of q<0.05 and fold change >1.5 were considered significant. All analyses were performed using the R statistical environment. Sphingolipid concentrations are shown using boxes, with the horizontal thick line within each box representing the median value. The whiskers extend to the most extreme data point (minimum and maximum value), which is no more than 1.5-times the interquartile range (i.e. remaining 50% of the data) from each box. Cer, Ceramide; SM, sphingomyelin; Sph, sphingosine.

