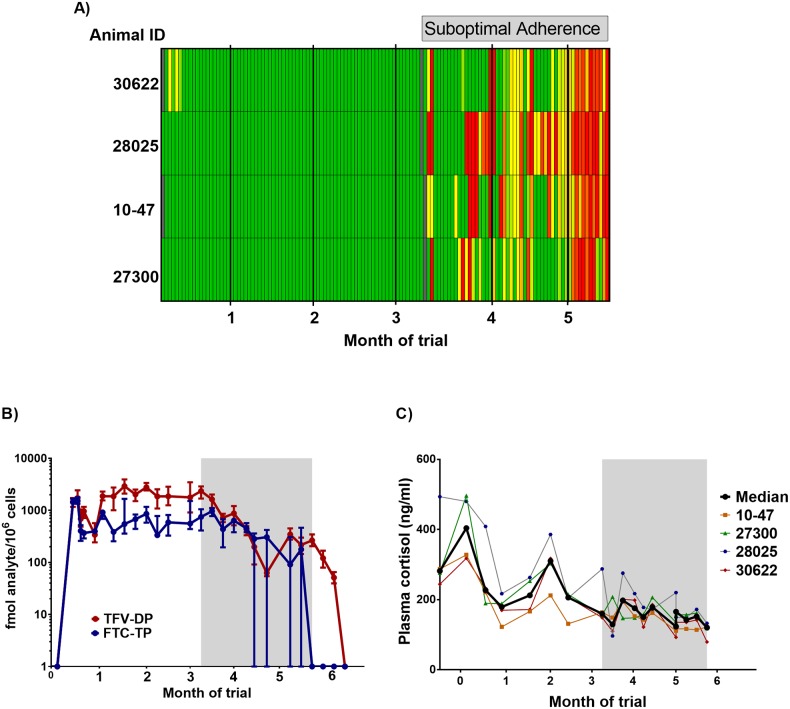
Fig 5. Adherence during extended treatment.
A) Adherence heat map. Macaques (n = 4) were administered daily doses of FTC/TAF in a blended drug delivery mixture. Days of drug administration is denoted in columns (one box = one day) and the four animals in the rows. Colors in the heat map reflect 100% of the dose eaten (green), 50% of dose eaten (yellow), and 0% of dose eaten (red). Days of drug administration by gavage are not included in the adherence map. Day of spleen biopsy are indicated with gray boxes. B) Concentrations of FTC-TP and TFV-DP in PBMCs. FTC-TP and TFV-DP were stable during the first three months coinciding with high adherence to daily oral FTC/TAF. The period of suboptimal adherence is highlighted by gray bar. C) Plasma Cortisol levels. The gray area denotes the period of suboptimal adherence.

