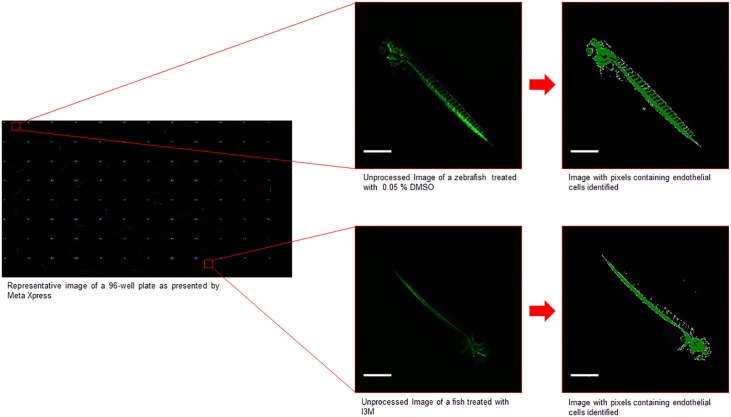
Fig 3. Visualization of the pixel count readout.
The image on the left is a composite of 2D images from each of the wells of a 96-well plate as presented by MetaXpress. The images on the right are blown up unprocessed and processed images from a well with 0.05% DMSO (negative control) and a well with 8 μM I3M (angiogenesis inhibitor). Scale bar is 700 μm.

