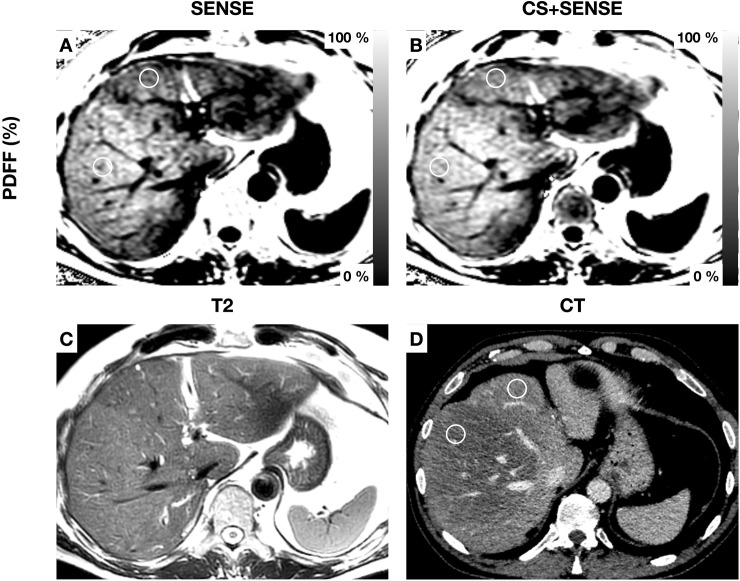
Fig 3. Patient with segmental hepatic steatosis.
Exemplary regions of interest are drawn in segments IVa and V (diameter 1.5cm). PDFF Segment IVa: acquisition with SENSE 25.7±1.5% (A); acquisition with CS+SENSE 26.9±2.0% (B) PDFF Segment V: acquisition with SENSE 31.6±1.8% (A); acquisition with CS+ SENSE 32.6±2.2 (B) A T2-weighted image (C) and a CT image in the venous contrast phase (D) are shown for comparison. In CT Hounsfield units are 87±13 in Segment IVa and 42±16 in Segment V.

