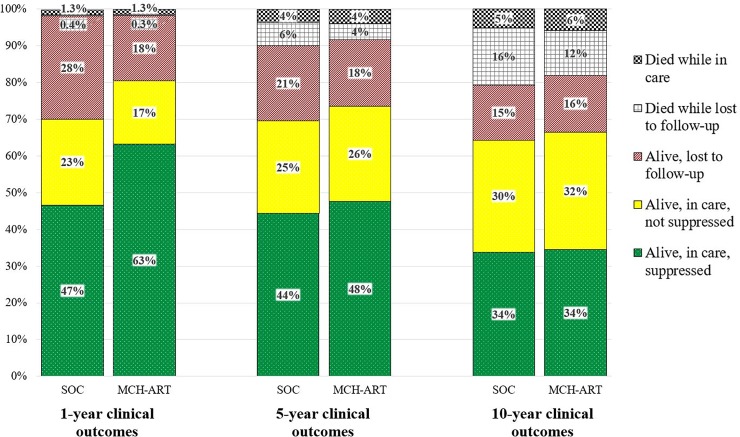
Fig 1. Maternal care cascade through 10 years postpartum.
Projected outcomes for the starting maternal cohort at 1, 5, and 10 years postpartum are shown for the standard of care (SOC; left bar) and MCH-ART (right bar) strategies. Cumulative maternal mortality at each time point is demonstrated by the checkered black (while lost to follow-up) and gray grid (while in care) sections. Among mothers alive at 1 year, 5 years, and 10 years, those lost to follow-up (red, diagonal lines), in care and not virologically suppressed (solid yellow), and in care and virologically suppressed (green, dotted) are depicted.

