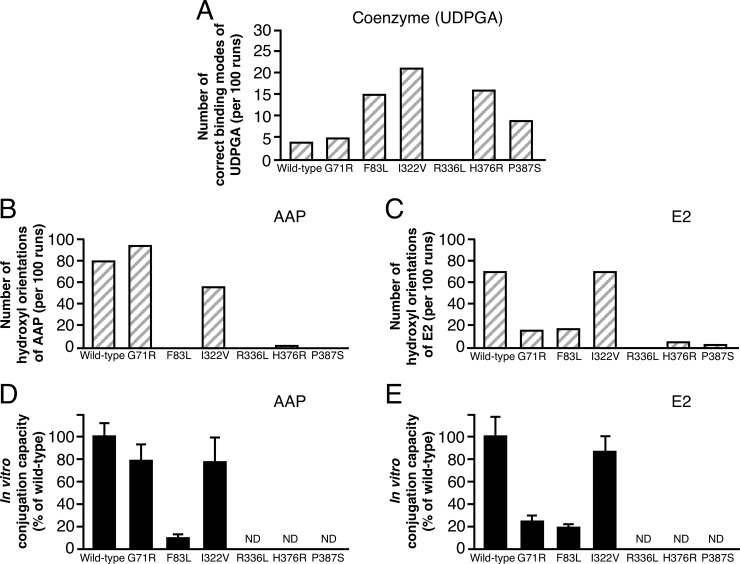
Fig 2. Comparison between docking results and in vitro conjugation capacities of wild-type UGT1A1 and UGT1A1 mutants for AAP and E2.
(A) The number of correct binding modes of UDPGA per 100 separate docking runs. (B and C) The number of hydroxyl orientations of substrate per 100 separate docking runs. S2 Table provides raw data for docking results for panels A, B, C, and D. (D and E) In vitro conjugation capacity. ND, not detected.

