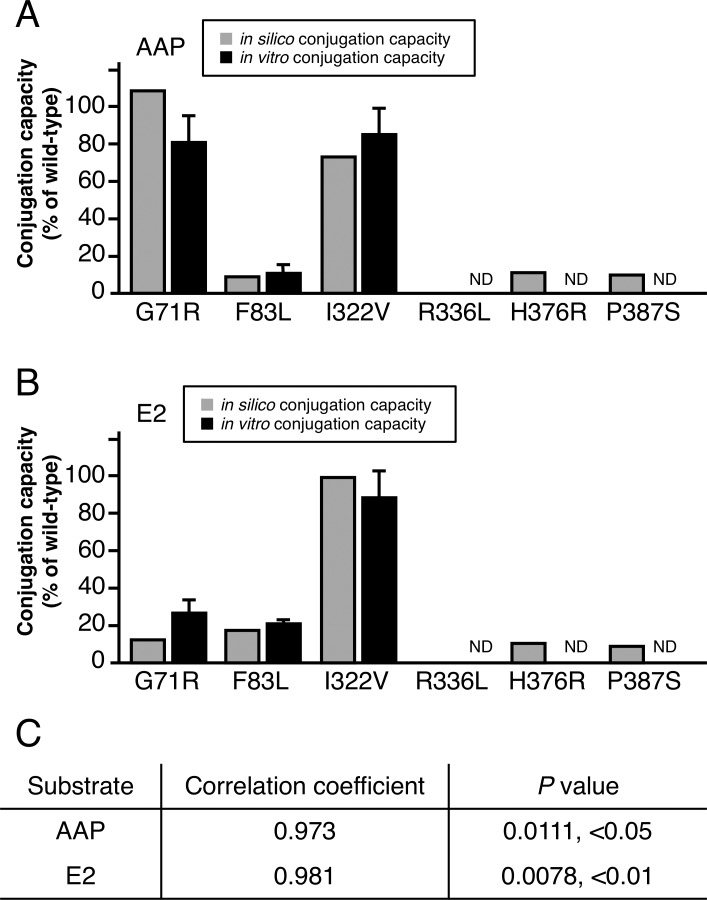
Fig 3. Cross-validation of in silico conjugation capacity of UGT1A1 with in vitro conjugation capacity.
(A) In silico conjugation capacities (gray bars) of AAP were compared with in vitro conjugation capacities (black bars). (B) In silico and in vitro conjugation capacities of E2 were compared, as done for AAP. (C) Pearson's correlation coefficient was used to assess cross-validation. ND, not detected.

