Figure 2.

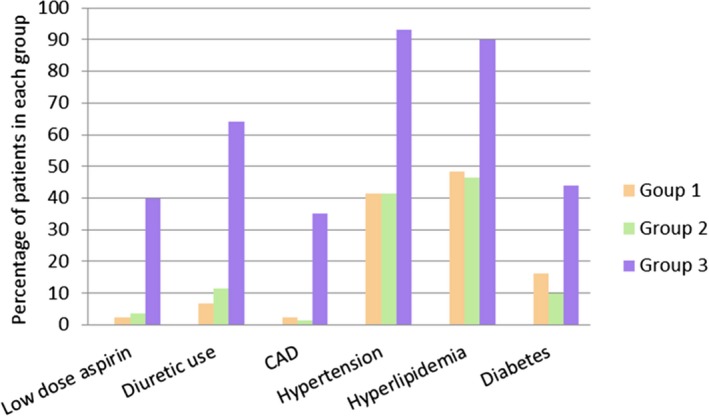
Medical comorbidities, aspirin, and diuretic use in each group. The y‐axis represents the percentage of patients within each age group having each condition.

Medical comorbidities, aspirin, and diuretic use in each group. The y‐axis represents the percentage of patients within each age group having each condition.