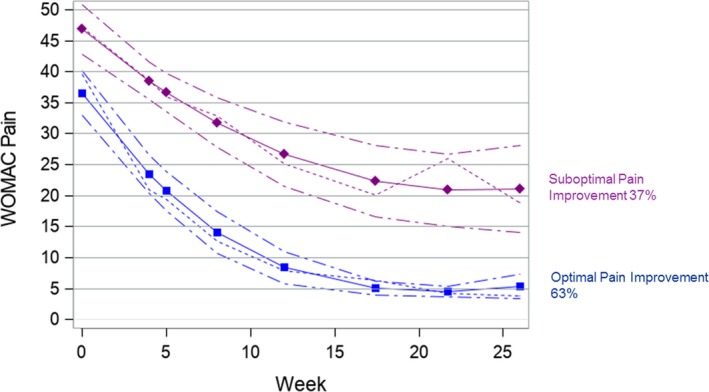
Figure 1.

Group‐based early improvement trajectories for the Western Ontario and McMaster Universities Arthritis Index (WOMAC) pain score. The WOMAC pain score is along the y‐axis, and follow‐up week is along the x‐axis. The short dashed lines depict the mean WOMAC pain score over 6 months post surgery. The solid lines depict the predicted trajectory, and the medium dashed lines represent 95% confidence intervals.
