
Figure 5.
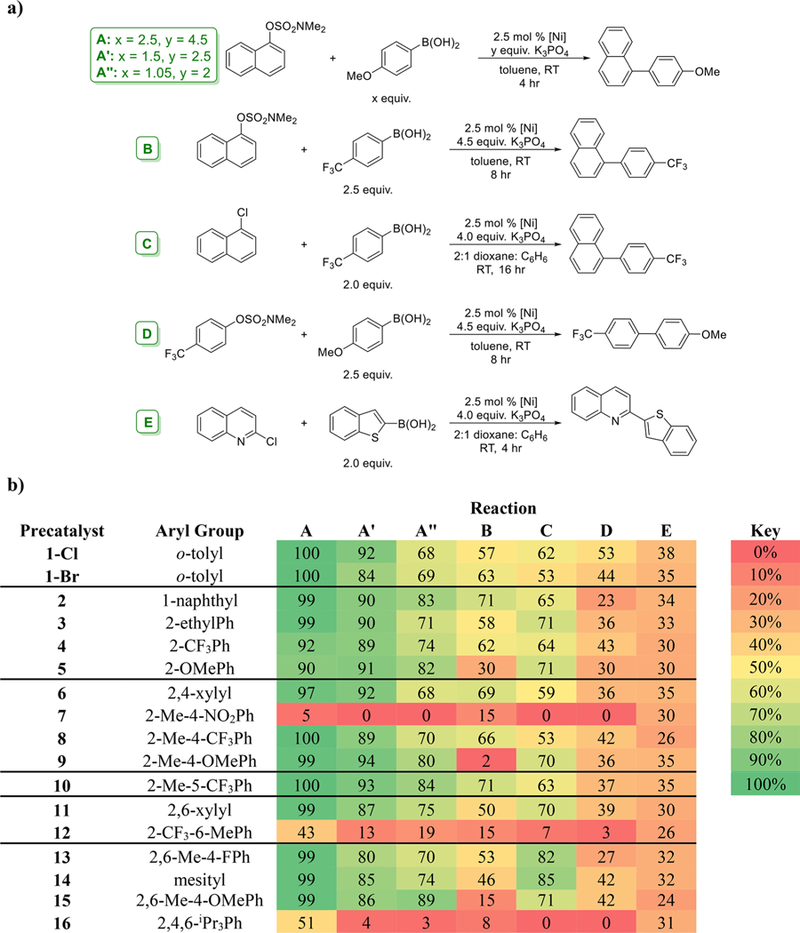
(a) Reactions screened in this work. (b) Heat map of cross-coupled product yield as a function of precatalyst and reaction screened. The values in the cells correspond to GC yields of cross-coupled product, reported as the average of at least two runs. The variability between runs was typically between 0 and 10%. Specific conditions for each reaction are provided in the Supporting Information.