. 2019 Nov 4;8:e51162. doi: 10.7554/eLife.51162

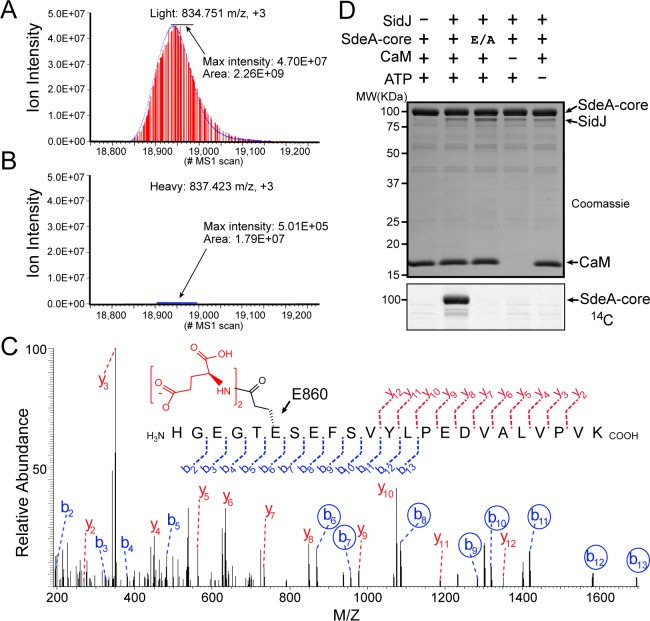
Figure 4. SidJ catalyzes the polyglutamylation of SdeA.

Reconstructed ion chromatograms for the SdeA peptide (residues 855–877) from (A) cells grown in light medium and co-transfected with GFP-SdeA and mCherry vector control or (B) cells grown in heavy medium and co-transfected with GFP-SdeA and mCherry-SidJ. (C) MS2 spectrum of a di-glutamylated SdeA mART peptide with b ions labeled in blue and y ions labeled in red. The peptide sequence corresponding to fragmentation is depicted above the spectrum. Circled b ions represent a mass increase corresponding to diglutamylation (258.085 Da). (D) In vitro glutamylation of SdeA with [U-14C]glutamate. E/A corresponds to the E860A point mutant of SdeA. Proteins were separated by SDS-PAGE and visualized with Coomassie stain (top panel). An autoradiogram of the gel is shown in the bottom panel.

Figure 4.

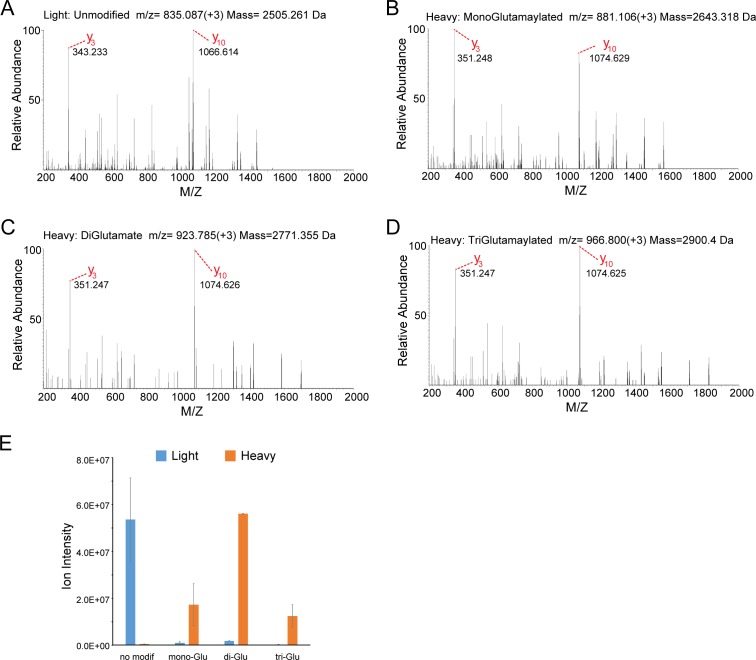
Figure 4—figure supplement 1. MS/MS analysis of the SdeA peptide modified by SidJ.

Figure 4—figure supplement 1.

(A) The MS2 spectrum of the SdeA peptide (residues 855–877, prepared from light medium) displays two signature ions, y3 and y10, which correspond to the two y ions generated from two labile prolines in the peptide. (B) A SdeA peptide (prepared from heavy medium) exhibits the same two signature ions (y3 and y10) but with a mass increase of 129.043 Da after subtraction of 8. 014 Da corresponding to the heavy Lys and 1 Da corresponding to natural 13C incorporation in the peptide. The 129.043 Da corresponds to the addition of a glutamate residue. (C) A similar SdeA peptide (prepared from heavy medium) produces y3 and y10 ions, but with a mass increase of 2 × 129.043 Da after accounting for the heavy Lys. (D) A SdeA peptide (prepared from heavy medium) exhibits the same two signature ions (y3 and y10) but with a mass increase of 3 × 129.046 Da. (E) Quantification of ion intensity for heavy and light samples of unmodified, mono-glutamylated, di-glutamylated, and tri-glutamylated SdeA mART peptides. Data are shown as means ± STD of three independent mass spectrometry data collections.
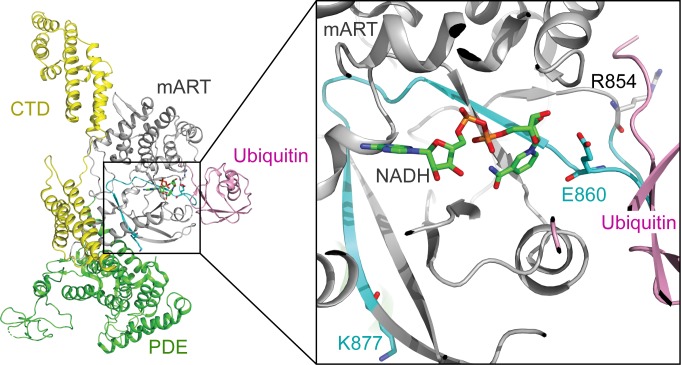
Figure 4—figure supplement 2. The structural context of the SdeA peptide modified by SidJ.

Figure 4—figure supplement 2.

Left: overall structure of SdeA in complex with Ub and NADH (PDB ID: 5YIJ). Right: enlarged view of the mART active site of SdeA. The peptide (residues 855–877) shown in cyan was polyglutamylated at residue E860 (shown in sticks) by SidJ, as detected by MS/MS analysis. The NADH is represented by sticks and colored in green.