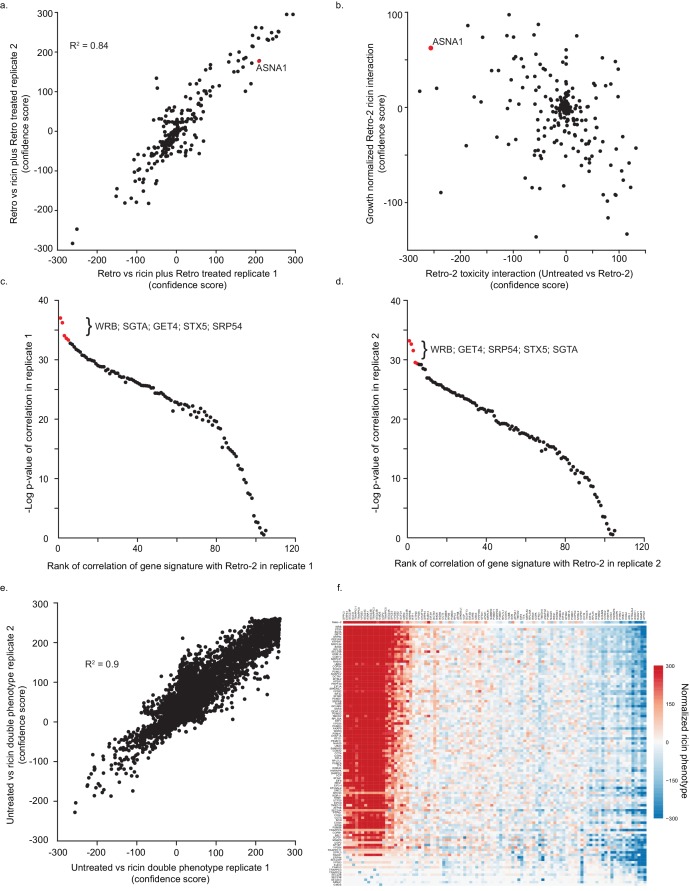
(A) Reproducibility of genes’ knockdown effect on ricin resistance in the presence of Retro-2 for the CRIPSRi single-gene screen. The value is calculated by comparing the enrichment of guides targeting each gene between the Retro-2 treated and ricin plus Retro-2 treated conditions. (B) Modifiers of Retro-2 activity. The x-axis indicates the change in growth phenotypes of gene knockdowns in the presence of Retro-2, calculated by comparing enrichment of guides between untreated and Retro-2 treated conditions. A positive value indicates that the gene knockdown is less toxic in the presence of Retro-2, and a negative value indicates that the gene knockdown is more toxic in the presence of Retro-2. The y-axis indicates the change in protective activity of a gene knockdown in the presence of Retro-2, normalized for the change in gene toxicity, calculated by comparing enrichments of guides between ricin and ricin plus Retro-2 treated conditions, normalizing for the guide enrichment between untreated and Retro-2 treated conditions. A positive value indicates that a knockdown is more protective against ricin in the presence of Retro-2, while a negative value indicates that a knockdown is less protective against ricin in the presence of Retro-2. (C) Summary of single-gene CRISPRi results. The y-axis indicates the ricin phenotype of genes in the presence of 10 µM Retro-2, calculated by comparing the enrichment of guides targeting each gene between the Retro-2 and Retro-2 plus 2.5 ng/µL ricin conditions. A positive value indicates the gene knockdown is protective against ricin and a negative value indicates the gene knockdown is sensitizing against ricin. The x-axis is similarly the change in ricin phenotype in the presence/absence of 10 µM Retro-2, calculated by comparing the ricin treated conditions to the ricin plus Retro-2 treated conditions. A positive value indicates that the gene knockdown is more protective or less sensitizing to ricin in the presence of Retro-2 while a negative value indicates the gene knockdown is less protective or more sensitizing in the presence of Retro-2. Top 100 genes are determined by the absolute value of the x-axis. ASNA1 is highlighted in red. (D,E) Reproducibility of genetic profiles. Genetic profiles for genes can be determined using single replicates of the paired-gene CRISPRi screen. The genetic profile measured by (D) replicate one or (E) replicate two can then be compared to the profile of Retro-2 from the single-gene CRISPRi screen. (F) Reproducibility of double phenotypes measured in the paired-CRISPRi screen. Positive scores indicate that the pair of knockdowns is protective against ricin; negative scores indicates sensitization. (G) Summary of paired-gene screen. The y-axis shows all 105 genes and their phenotypic profiles in the pairwise CRISPR experiment as well as the phenotypic profile of Retro-2 in the single-gene experiment. The x-axis shows all 101 genes tested in both experiments. Each entry is the normalized ricin phenotype of the double gene knockdown (or the single gene knockdown in the Retro-2 treated sample). The normalized ricin phenotype was calculated as the enrichment for all 9 pairs of sgRNAs targeting both genes (3 × 3 per gene pair) comparing untreated and ricin treated samples. The median ricin phenotype for each row was then subtracted from each entry. Order of rows indicates the rank of correlation of each gene to Retro-2. Order of columns is the ranked order of scores for the top correlate, WRB.


