. 2019 Nov 1;8:e48434. doi: 10.7554/eLife.48434

Figure 3. ASNA1 knockdown and Retro-2 treatment both decrease the abundance of Golgi-localized STX5, an ASNA1 substrate.

(A) HeLa cells expressing either ASNA1-targeting or scrambled control (shCtrl) shRNAs were treated for 24 hr with DMSO or 10 μM Retro-2 before fixation and staining for STX5, a Golgi marker (GM130), and a nuclear marker (DAPI). Shown are maximal signal projections of z-stacked confocal micrographs taken with a 100× objective and made without contrast or LUT adjustments. Scale bar represents 25 µm and applies to all images. (B) HeLa cells were treated as in part a) but including additional shRNAs and the hyperactive Retro-2 analog DHQZ36.1. Images were collected using a 60× objective and quantitatively analyzed. Shown are box plots of per cell mean STX5 intensity at GM130-marked Golgi for the indicated treatments. Asterisks specify significant differences between treatments as calculated by the MW U test.

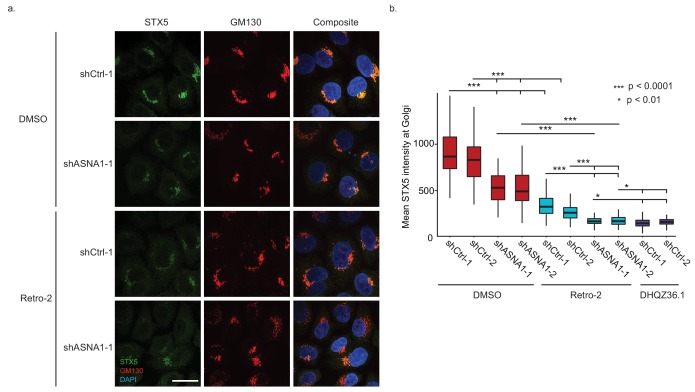
Figure 3.

Figure 3—figure supplement 1. Effect of ASNA1 knockdown or Retro-2 and DHQZ36.1 in HeLa cells.

Figure 3—figure supplement 1.

(A) Dose curves for the protective effect of Retro-2 against ricin cytotoxicity in HeLa cells expressing either shRNAs targeting ASNA1 or scrambled negative controls. Cells are pretreated with the indicated drug concentration, then treated with ricin for 24 hr. Ricin was washed out and cells were imaged for 72 hr on an Incucyte. Confluency of cells was calculated using phase images and is presented as 100 minus the percent confluency. (B) Dose curves for DHQZ36.1 relative to Retro-2. Cells were treated and imaged as above. (C) Additional confocal images of HeLa cells expressing either ASNA1-targeting or scrambled control (shCtrl) shRNAs, treated with DMSO, 10 µM Retro-2 or 3 µM DHQZ36.1, which were used for quantitative analysis in Figure 3b. Cells were fixed and imaged as in Figure 3a. Scale bar represents 25 µm and applies to all images.