. 2019 Nov 1;8:e48434. doi: 10.7554/eLife.48434

Figure 4. Isolation and characterization of A149V ASNA1, a Retro-2-resistance allele.

(A) Schematic of ASNA1 mutagenesis by CRISPR-X. A 172 sgRNA library tiling the ASNA1 coding region was lentivirally infected in a K562 cell line expressing a dCas9-AID*Δ N-terminal fusion. The pool was then grown in duplicate in the presence of 20 μM DHQZ36.1 for 4 weeks. ASNA1 was amplified separately from cDNA of naive and treated cell populations before being sequenced by Nextera XT. (B) Plot of the frequency of ASNA1 alleles across the gene-body (x-axis) in the initial CRISPR-X population (pre-selection) and in one replicate of the selected population. Allelic fraction was calculated by determining the per-base variant frequency that is the number of reads which contain a mutated base at a given position vs the number of reads which contain the wildtype base at that position. Bases which had less than 500× read coverage were excluded, resulting in no resolution of the 5’/3’ ends of ASNA1. The top selected mutation in both replicates is highlighted. (C) A homology model of human ASNA1 (SWISS-MODEL: O43681) with the location of the top mutated residue, A149, enriched after selection by DHQZ36.1 toxicity highlighted in red on one ASNA1 (colored in green) of the homodimer. (D) A149V was installed by homology directed repair in a K562 cell line expressing Cas9. The resulting mutant line was treated with ricin toxin in the presence of 10 μM Retro-2 or DMSO. Live cells were counted using forward/side scatter by cytometry. Shown are bar graphs of the mean with standard error from three technical replicates. Also shown are data for five control lines treated in the same way. See Materials and methods for further details. (E) Clonal wildtype (black circles), ASNA1 A149V (C460T) (red squares), and ASNA1 A149A (C461T) (blue triangles) K562 cell lines with the GFP-2A-RFP-SEC61BTMD reporter were pre-treated with Retro-2 with the indicated concentrations for 1 hr prior to induction with dox for approximately 18 hr and FACS analysis. Shown are the dose-response curves for the reporter RFP to GFP ratios as relative means (three experiments) to mock-treated wildtype cells. The dose response was modeled using the four-parameter logistic regression to determine the half maximal effective concentration (EC50 ± standard error). Error bars for the means represent the standard error calculated from the four-parameter logistic regression.

Figure 4—source data 1. Results for CRISPR-X experiments to identify ASNA-1 mutations resistant to Retro-2.
DOI: 10.7554/eLife.48434.015

Figure 4.

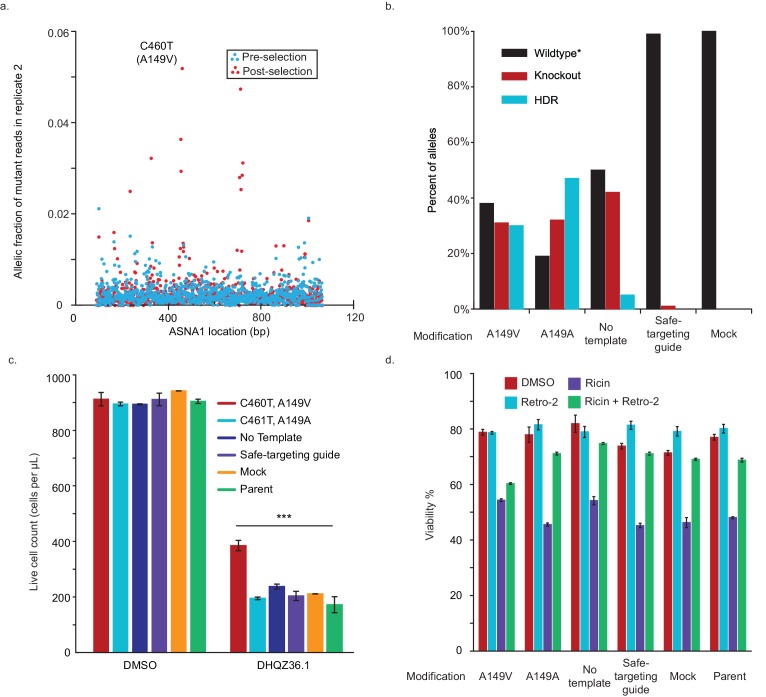
Figure 4—figure supplement 1. Replication and validation of CRISPR-X screen.

Figure 4—figure supplement 1.

(A) Allelic fraction of ASNA1 mutations post-selection for second replicate. The frequency of mutations across the gene-body of ASNA1 in the second replicate of the selected population. Top mutation in both replicates is C460T, which results in an alanine to valine coding mutation (A149V). Allelic fraction was calculated by determining the per-base variant frequency that is the number of reads which contain a mutated base at a given position vs the number of reads which contain the wildtype base at that position. (B) A149V substitution was installed using homology directed repair (HDR) in a Cas9-expressing K562 line. As negative controls, the synonymous, PAM-breaking mutant C461T (A149A) was also installed, along with a no template, a safe-targeting guide, mock, and parent control line. HDR and knockout frequencies were then monitored via Sanger sequencing of pooled cells and quantified using ICE. Alleles were considered wildtype* if they did not contain the intended mutation and had either no change or a frame-preserving insertion/deletion. (C) ASNA1 A149V is resistant to DHQZ36.1-induced toxicity. Indicated pooled cell populations were treated with 20 µM DHQZ36.1 for four days and live cells were counted using forward/side scatter. Error bars indicate standard error of the mean from three technical replicates. (D) Indicated cell populations were treated with ricin toxin in the presence of 10 µM Retro-2 or DMSO. Viability of treated cells was measured by cytometry on the basis of forward/side-scatter. Shown are bar graphs of the mean with standard error from three technical replicates. Also shown are data for five control lines treated in the same way. See Materials and methods for further details.
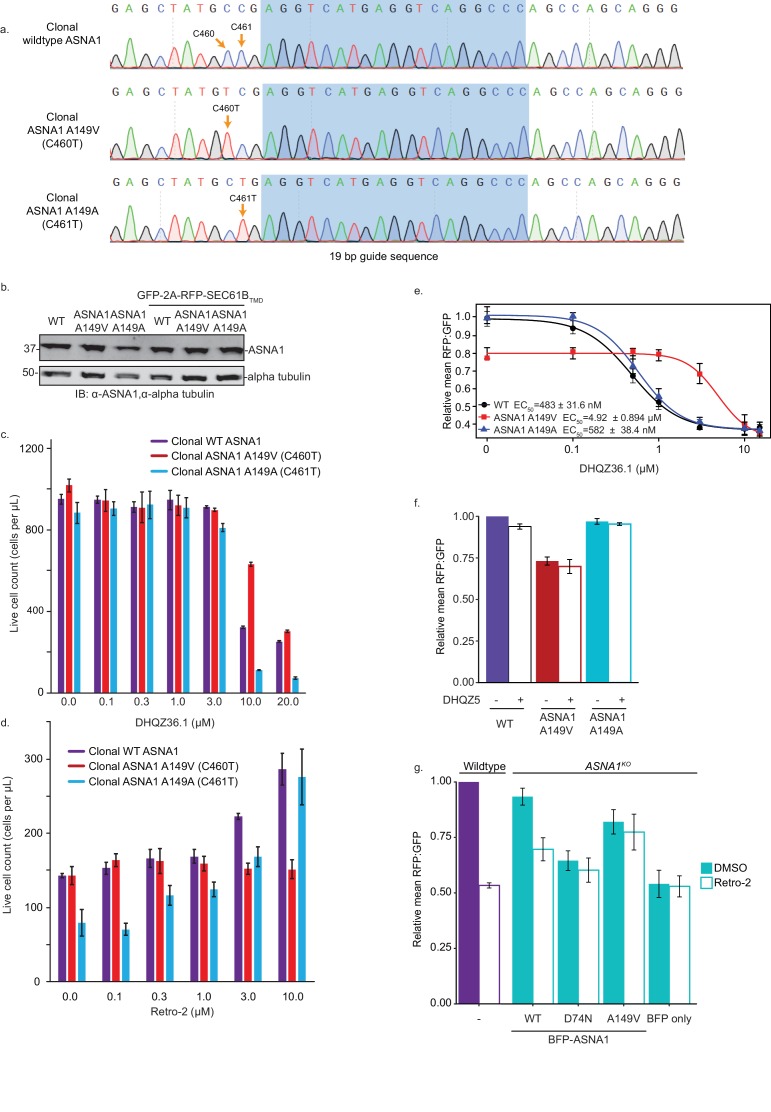
Figure 4—figure supplement 2. Characterization of clonal ASNA1 A149V cells.

Figure 4—figure supplement 2.

(A) Clonal K562 lines containing the mutant A149V (C460T), synonymous A149A (C461T), and wildtype ASNA1 alleles were generated by single cell sorting of edited pools. Homozygous ASNA1 alleles were confirmed by Sanger sequencing. (B) Whole lysates were prepared from clonal wildtype, ASNA1 A149V (C460T), and ASNA1 A149A (C461T) K562 cells either lacking or transduced with the GFP-2A-RFP-SEC61BTMD TA reporter. Samples were subjected to SDS-PAGE and visualized by immunoblotting (IB). Alpha tubulin served as the loading control. (C) Clonal lines were treated with various concentrations of DHQZ36.1 for 5 days and the number of live cells was then counted by cytometry, using FSC/SSC to determine viability. Error bars represent error of the mean from three replicates. (D) The ricin sensitivity and Retro-2 rescue of clonal K562 lines. Cells were pretreated for 24 hr in the indicated Retro-2 concentration before treated with ricin toxin for 24 hr. 72 hr later live cell number was assessed using cytometry and forward/side scatter. Error bars represent error of the mean from three replicates. (E) Clonal wildtype (black circles), ASNA1 A149V (C460T) (red triangles), and ASNA1 A149A (C461T) (blue triangles) K562 cell lines with the GFP-2A-RFP-SEC61BTMD reporter were pre-treated with DHQZ36.1 for 1 hr prior to induction with dox for approximately 18 hr and FACS analysis. Shown are the dose-response curves for the reporter RFP to GFP ratios as relative means (three experiments) to mock-treated wildtype cells. The dose response was modeled using the four-parameter logistic regression to determine the half maximal effective concentration (EC50 ± standard error). Error bars for the means represent the standard error calculated from the four-parameter logistic regression. (F) Clonal wildtype, ASNA1 A149V (C460T), and ASNA1 A149A (C461T) K562 cell lines with the GFP-2A-RFP-SEC61BTMD reporter were pre-treated with the 10 µM DHQZ5 or mock-treated with DMSO for 1 hr prior to induction with dox for approximately 18 hr and FACS analysis. Shown are bar graphs of reporter RFP to GFP ratios with standard deviations derived from three experiments as relative means to mock-treated wildtype cells. (G) ASNA1KO HEK293T cells expressing GFP-2A-RFP-SEC61BTMD were transiently transfected with indicated BFP-ASNA1 variants or BFP. The resulting transfected cells and untransfected wildtype control were pre-treated with 10 µM Retro-2 for 1 hr prior to induction with dox for 24 hr and FACS analysis. Shown are bar graphs of the means ± standard deviation (three experiments) of RFP to GFP ratios normalized to untransfected wildtype.