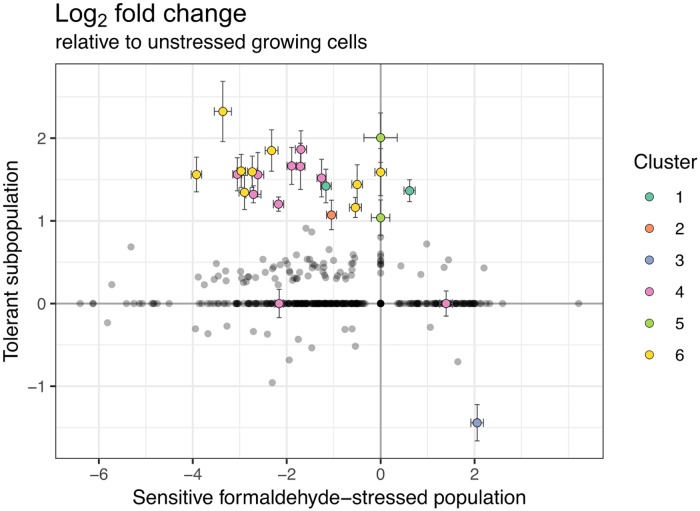
Fig 5. Gene expression in the formaldehyde-tolerant subpopulation is distinct from that of both unstressed and formaldehyde-stressed sensitive populations.
RNA sequencing was carried out on cells from a 4 mM formaldehyde exposure experiment harvested at 4 hours (sensitive cells losing viability due to formaldehyde toxicity), and 64 hours (selected formaldehyde-tolerant cells in exponential growth in the presence of formaldehyde). Log2 fold change was calculated relative to an unstressed population growing in the absence of formaldehyde. Each circle represents the expression of one gene in the tolerant population (y-axis) versus in the sensitive population (x-axis). Colored circles are genes with >1.0 log2 fold change and padj <0.001 in the tolerant population, as well as genes belonging to the same clusters in the genome (23 genes total, 6 clusters); these are described in Table 1. Error bars indicate standard error for the log fold change estimate. Most genes that were differentially expressed in the tolerant population showed opposite expression patterns in the stressed population.

