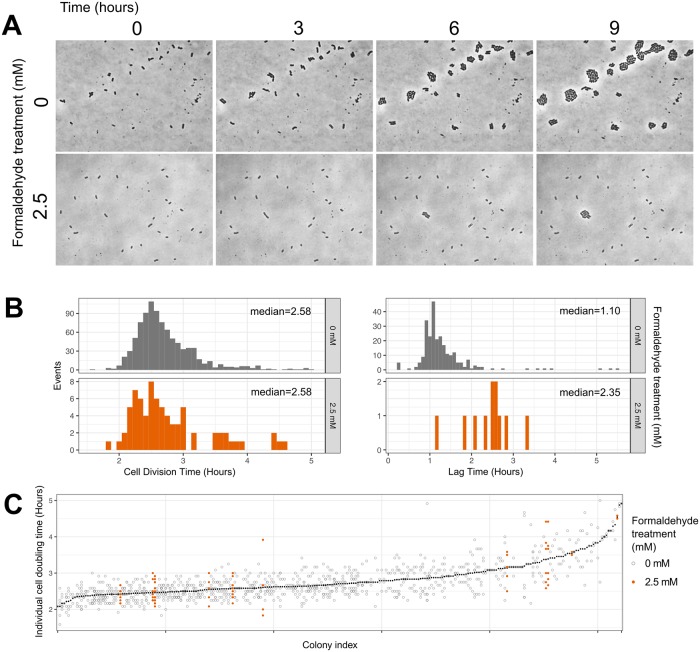
Fig 6. Time-lapse microscopy reveals binary (i.e., growth or non-growth) phenotypes in response to formaldehyde.
A) Example images: cells were embedded in agar medium with methanol and either 0 mM (top) or 2.5 mM (bottom) formaldehyde and monitored for 9 hours (~3 generations). At 0 mM, 256 cells were observed and all underwent at least one doubling; at 2.5 mM, 546 cells were observed and 11 (1.97%) underwent at least one doubling, in accordance with our predictions for this formaldehyde concentration (see Fig 7). B) Histograms of cell division time (across all generations) and lag time (time between deposition and first cell division, for each microcolony) for cells that grew. No difference was observed in cell division time between the two treatments (p = 0.262, Mann-Whitney Wilcoxon test). However, cells in formaldehyde took approximately 1.25 hours longer to reach the first cell division (p<0.001, Mann-Whitney). C) Scatterplot of individual cell doubling times; each position along the x-axis represents a single microcolony, ordered by mean doubling time (shown in black symbols). Individual doubling time of each cell was strongly predicted by the colony it came from (p = 0.001) but not by formaldehyde treatment (p = 0.323, PERMANOVA).

