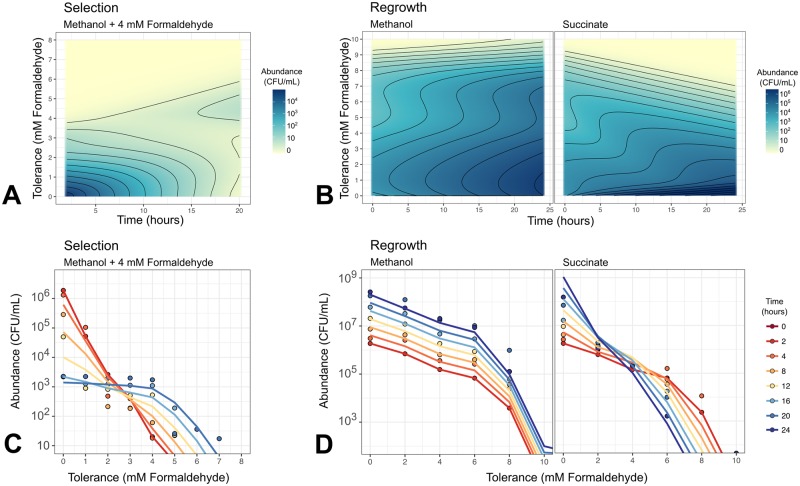
Fig 10. Mathematical modeling reproduces growth, death, and phenotype transition dynamics of M. extorquens population under multiple conditions.
A) and B) Heat maps showing model simulations of population dynamics. Model parameters as given in Table 2. Note that model results are continuous in phenotype space, and non-cumulative (the abundance at concentration x shows only the number of cells for which that is the maximum concentration tolerable, not the number of all cells that can grow at that concentration; see Methods for details). C) and D) Comparison of model results (lines) and experimental data (points). Experimental data are averages of 3 biological replicates; model results have been binned at 1- or 2-mM intervals, and summed to form cumulative distributions, to facilitate comparison. A and C) 4 mM formaldehyde exposure experiment, resulting in selection of cells with >4 mM tolerance. B and D) Formaldehyde-free regrowth experiment, in which the selected high-tolerance population is transferred to medium without formaldehyde and either methanol or succinate as the carbon substrate, resulting in different shifts in phenotype distribution.

