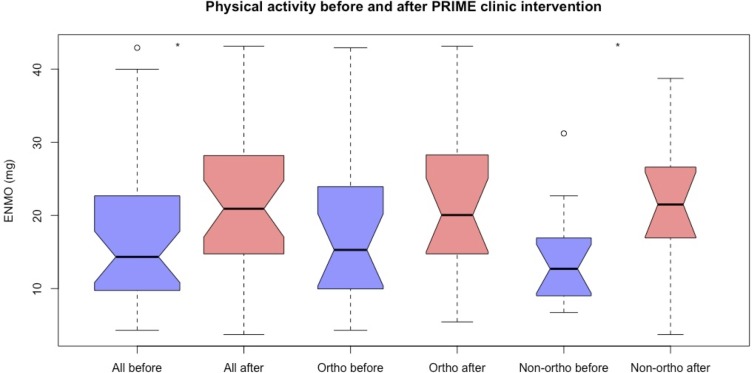
Figure 1.
Notched box plots representing physical activity (Euclidian norm minus one (ENMO), milligravitational units mg) before (blue) and after (red) the perioperative review informing management of elderly patients (PRIME) clinic intervention in all participants (left), participants listed for orthopaedic surgery (middle) and non-orthopaedic surgery (right). Open circle (o) represents outliers. The notch represents the 95% CI of the median; 95% CI that the medians differ if two boxes’ notches do not overlap. Significant differences between ‘before-’, and ‘after-’ intervention groups are indicated with an asterisk (*).

