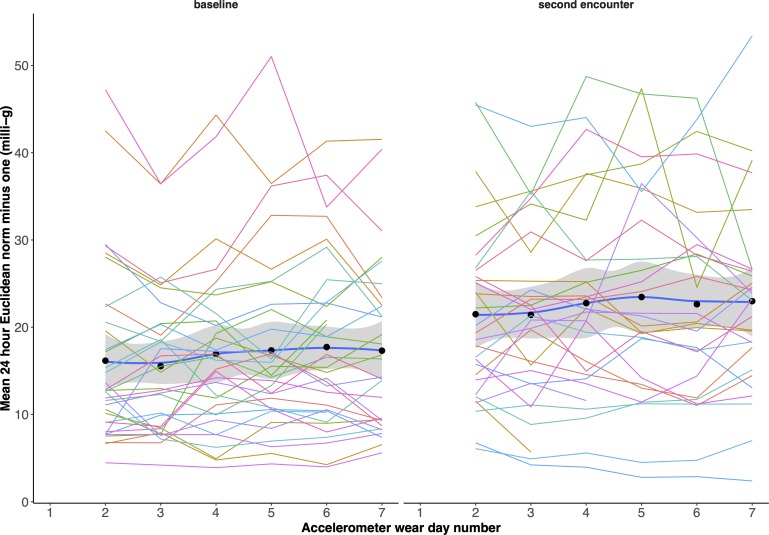
Figure 2.
Physical activity (ENMO) against time before (left panel) and after (right panel) the intervention for each patient. The dots/blue lines represent the mean across the patient group with ±1 SD shaded. Only complete (2–6) days included. Mean physical activity is increased after the intervention with no discernible decline in activity over time.

