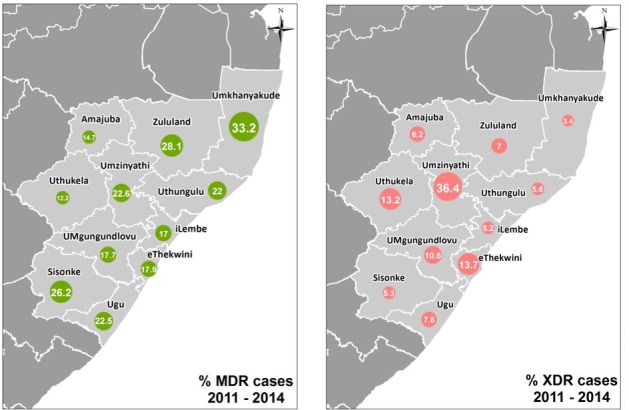
Figure 5.

The first panel depicts the percentage of MDR-TB cases per district for the period 2011–2014. The percentage of MDR-TB cases among TB cases diagnosed by culture between 2011 and 2014. The size of the circle represents the percentage. The second panel depicts the percentage of XDR-TB cases per district for the period 2011–2014. The percentage of XDR-TB cases among MDR-TB cases diagnosed by culture between 2011 and 2014. The map was produced specifically for the purposes of this study, it is therefore not under copyright. MDR-TB, multidrug-resistant tuberculosis; XDR-TB, extensively drug-resistant tuberculosis.
