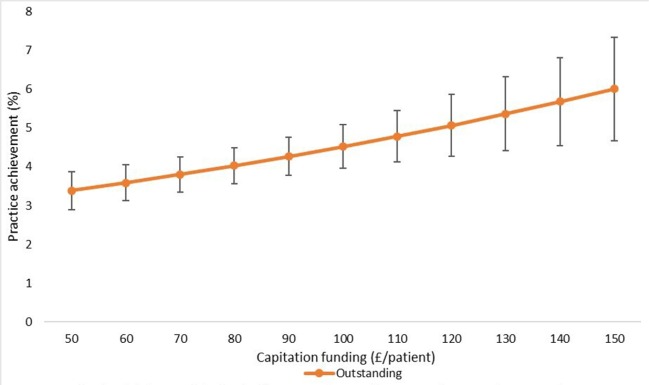
Figure 3.
Estimated probability of overall practice rating of ‘outstanding’ at various levels of capitation funding per registered patient. Average predicted probability at each funding level (accounting for year effects, patient & practice characteristics) Mean values displayed with 95% confidence intervals.

