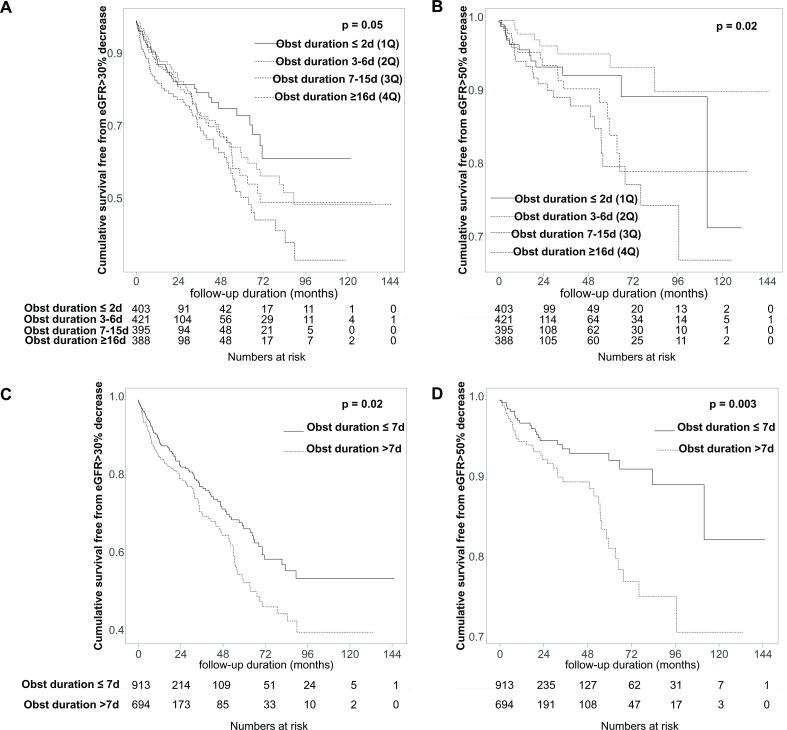
Figure 2.
Kaplan-Meier curves for renal outcomes. (A, B) When the prognosis was evaluated by quartile of obstruction duration of all patients, the longer the obstruction duration the greater the likelihood of a decrease in GFR of more than 30% (log-rank p for pooled analysis=0.052, pairwise analysis; p=0.009 for 1Q vs 3Q, p=0.037 for 2Q vs 3Q) (A) and a decrease in GFR of more than 50% (p for pooled analysis=0.016, pairwise analysis; p=0.002 for 2Q vs 3Q, p=0.022 for 2Q vs 4Q) (B). (C, D) When we compared the results of the two groups, there was a significant increase in the possibility of GFR reduction >30% (p=0.022) (C) and >50% (p=0.003) (D) in group 2. 1Q, first quartile; 2Q, second quartile; 3Q, third quartile; 4Q, fourth quartile; eGFR, estimated glomerular filtration rate; GFR, glomerular filtration rate; Obst, obstruction.

