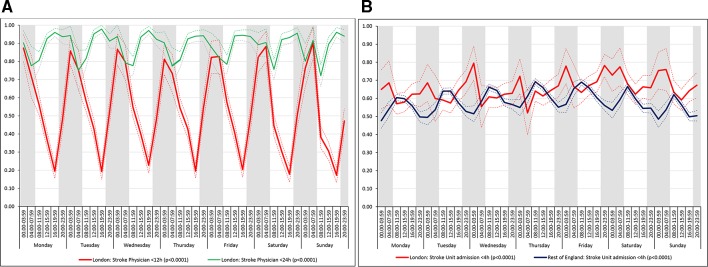
Figure 3.
Quality of care across the 42 time periods in the week: variation by time of day but not day of the week (A) assessment by a stroke specialist consultant physician within 12 and 24 hours in London HASUs and (B) admission to a stroke unit within 4 hours. Note: Figures are average predicted probabilities of each outcome in each time period controlling for the covariates. Dashed lines represent lower and upper 95% confidence limits. Shaded areas indicate 20:00 to 07:59 each day of the week. P values indicate significant variation (p<0.05) or not for each measure over the week in each region. Figure 3A includes two measures for London HASUs. HASU, hyperacute stroke units.

