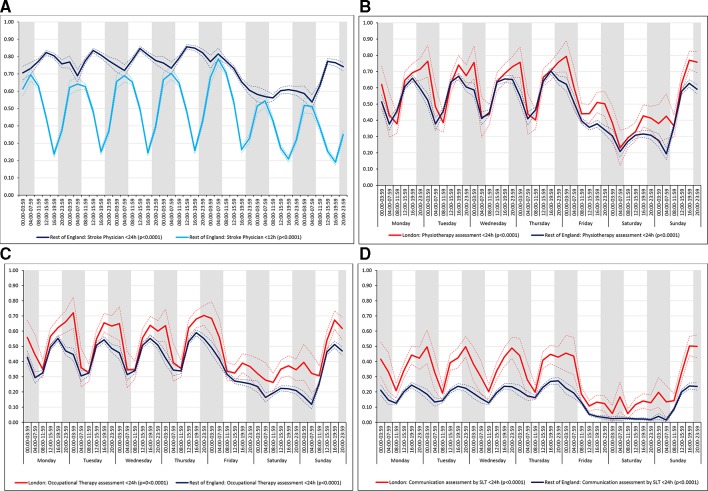
Figure 5.
Quality of care across the 42 time periods in the week: variation by time of day and day of the week (A) assessment by a stroke specialist consultant physician within 12 and 24 hours in rest of England, (B) physiotherapist assessment within 24 hours, (C) occupational therapist assessment within 24 hours and (D) communication assessment by a speech and language therapist within 24 hours. Note: Figures are average predicted probabilities of each outcome in each time period controlling for the covariates. Dashed lines represent lower and upper 95% confidence limits. Shaded areas indicate 20:00 to 07:59 each day of the week. P values indicate significant variation (p<0.05) or not for each measure over the week in each region. Figure 5A includes two measures for rest of England.SLT, speech and language therapist.

