
Fig. 4. Time evolution of the number of interfacial CC bonds.
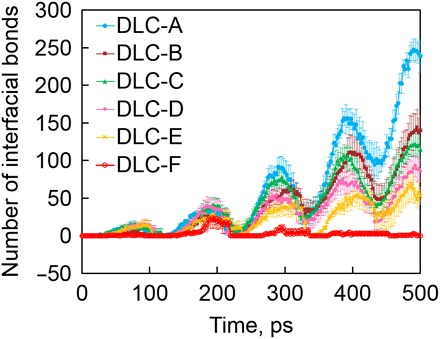
─ Blue solid circles, brown squares, green triangles, pink diamonds, orange crosses, and red open circles indicate the results for DLC-A, DLC-B, DLC-C, DLC-D, DLC-E, and DLC-F, respectively. The error bar for each sample indicates that the SE is calculated from four individual simulations with different initial structures.