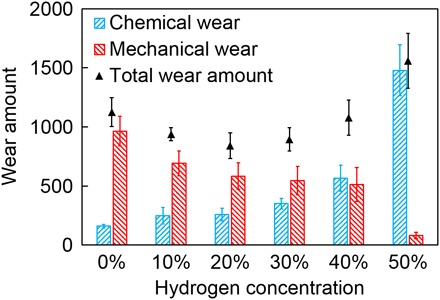
Fig. 6. Wear amount versus hydrogen concentration.

Blue and red bars indicate the amount of chemical wear and mechanical wear, respectively. Black triangles indicate the total wear amount as the sum of the chemical and mechanical wear. The error bar for each sample indicates that the SE is calculated from four individual simulations with different initial structures.
