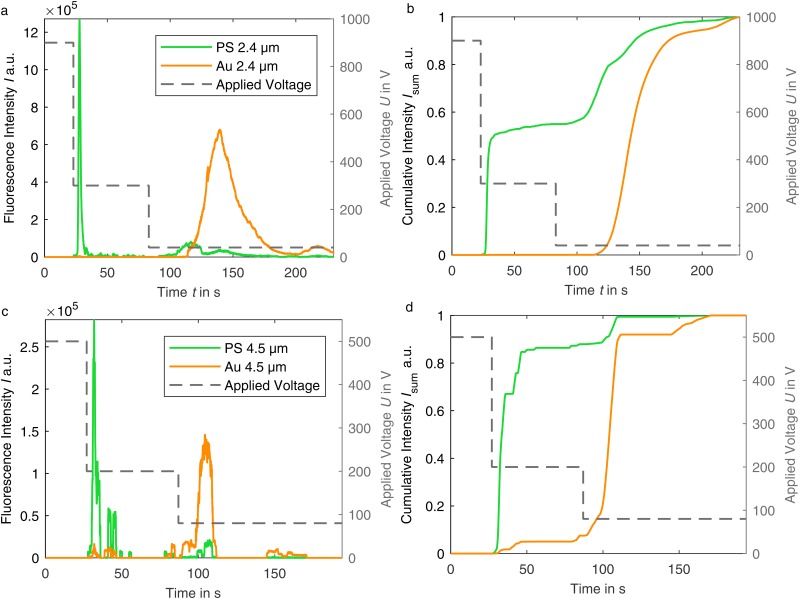
FIG. 8.
(a) and (c) Dielectropherogram of particles in adapted suspension (pH 7.05/pH 7.2). Fluorescence intensity at the channel outlet over the test period. Before recording, the particles were trapped for 60 s–70 s at the inlet at highest voltage. With voltage reduction, the PS particles are released, followed by smaller PS agglomerates and then gold-coated particles. (b) and (d) Corresponding cumulative sum curves of the intensity normalized to the maximum intensity.

