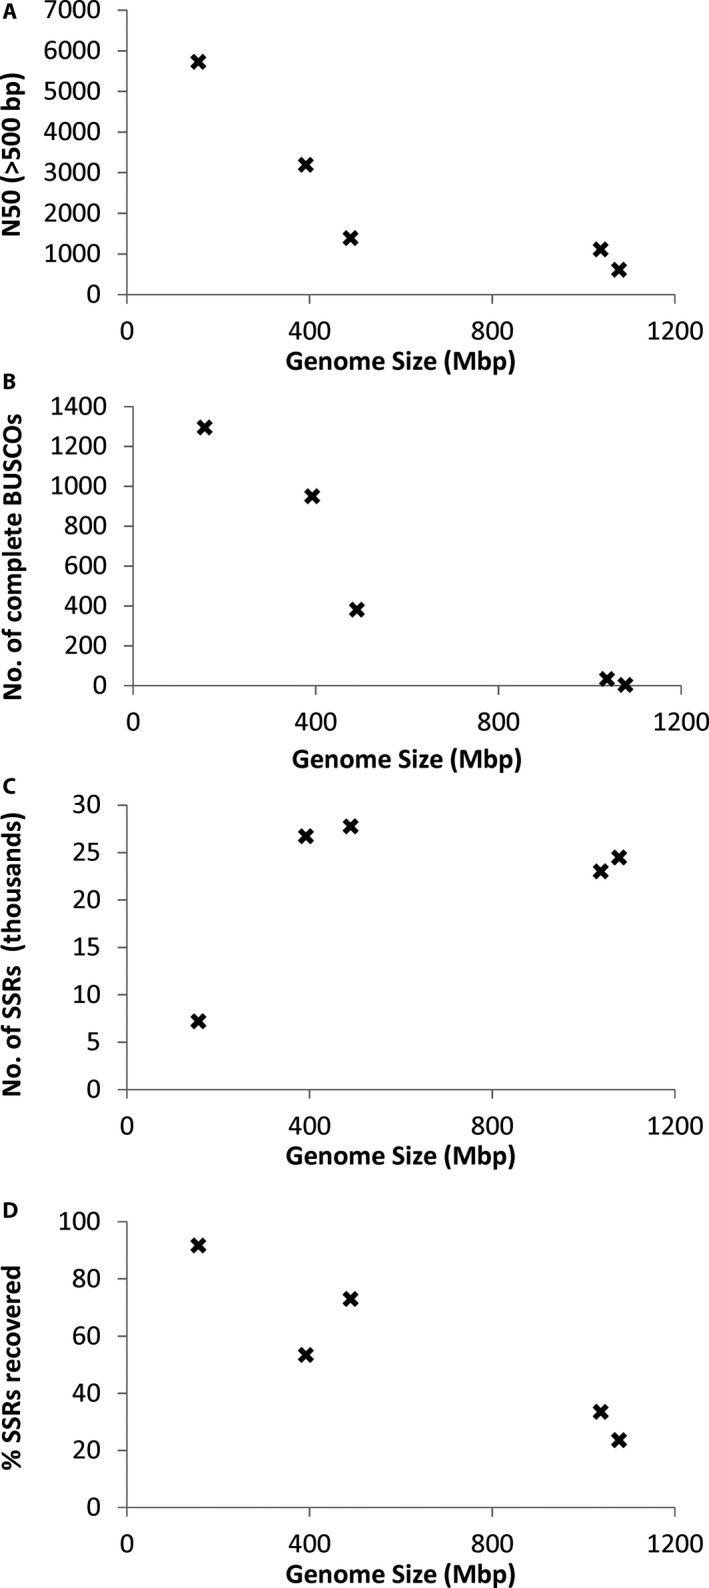
Figure 2.

Correlations between genome size and N50 (A), number of complete BUSCOs (Benchmarking Universal Single‐Copy Orthologs) (B), number of simple sequence repeat (SSR) markers identified (C), and the percentage of SSRs recovered (i.e., relative to the number of SSRs predicted from the published genome sequence) (D).
