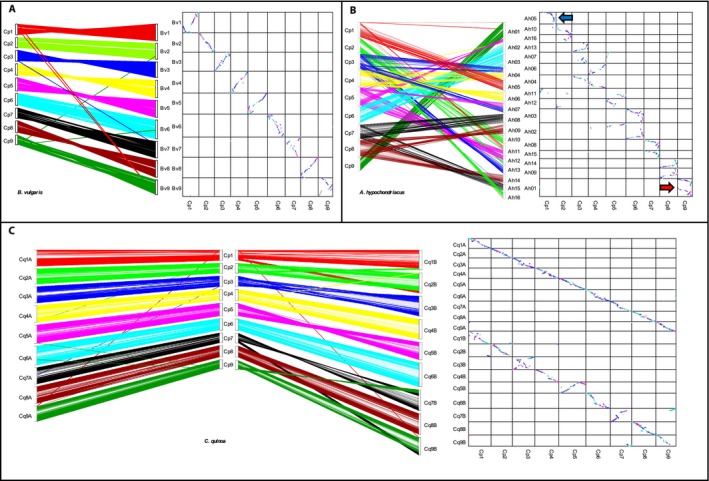
Figure 4.

Genomic comparison of cañahua with beet, amaranth, and quinoa. Synteny dot plot (left) and dual syteny plots (right) show syntenic regions between cañahua and beet (A), amaranth (B), and quinoa (C) coding sequences. The dual synteny plot of the quinoa genome is divided into A‐ and B‐subgenomes with cañahua in the center. Increasing color intensity is associated with increasing homology in the dot plots. The arrows identify the chromosomal fusion (red) and loss (blue) in amaranth.
