Fig. 3.

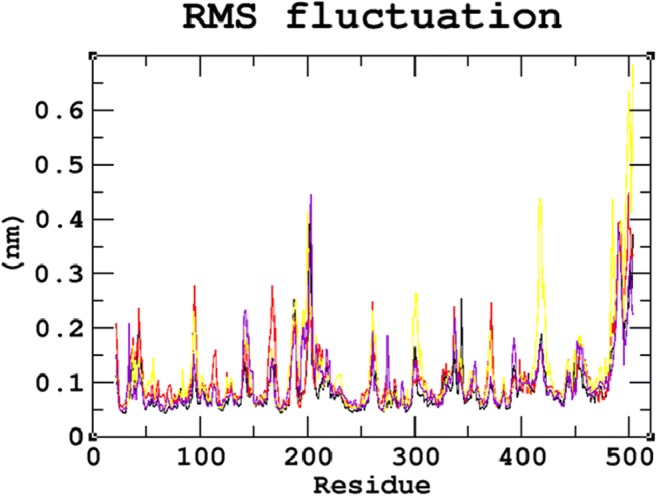
Root Mean Square Fluctuation (RMSF) graph for the 30ns MDS of native and mutant proteins. Color scheme: (a) native (black), (b) R74C (red), (c) S66W (yellow), and (d) R245H (violet)

Root Mean Square Fluctuation (RMSF) graph for the 30ns MDS of native and mutant proteins. Color scheme: (a) native (black), (b) R74C (red), (c) S66W (yellow), and (d) R245H (violet)