
Fig. 3.
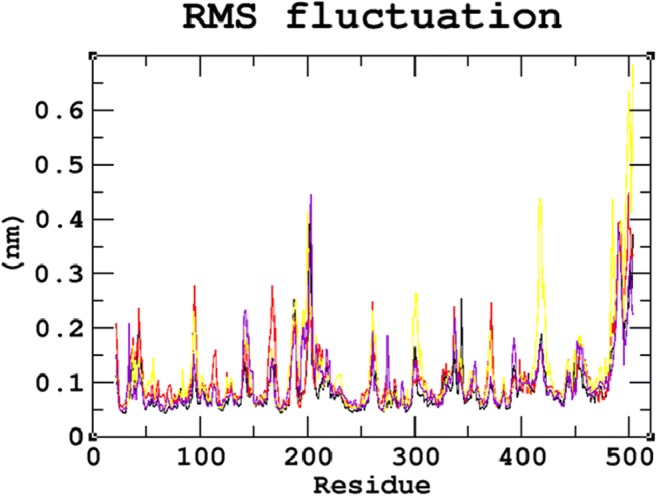
Root Mean Square Fluctuation (RMSF) graph for the 30ns MDS of native and mutant proteins. Color scheme: (a) native (black), (b) R74C (red), (c) S66W (yellow), and (d) R245H (violet)
Official websites use .gov
A
.gov website belongs to an official
government organization in the United States.
Secure .gov websites use HTTPS
A lock (
) or https:// means you've safely
connected to the .gov website. Share sensitive
information only on official, secure websites.
Root Mean Square Fluctuation (RMSF) graph for the 30ns MDS of native and mutant proteins. Color scheme: (a) native (black), (b) R74C (red), (c) S66W (yellow), and (d) R245H (violet)