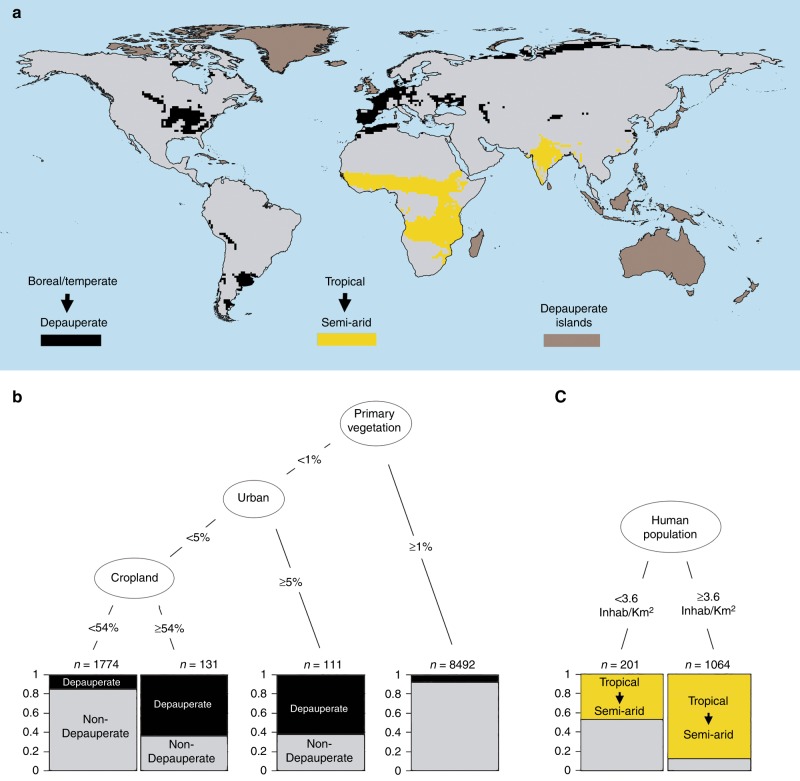
Fig. 4.
Relationship between transitions in trophic structures and human impacts. a World distribution of differences between observed and predicted trophic structures (i.e., transitions). b Tree model linking human impacts to trophic structure transitions from boreal or temperate to depauperate. c Tree model linking human pressures to trophic structure transitions from tropical to semi-arid. Terminal nodes indicate the number of cells in the category (n) and the ratio of cells in each category (indicated in the y-axis, see text)

