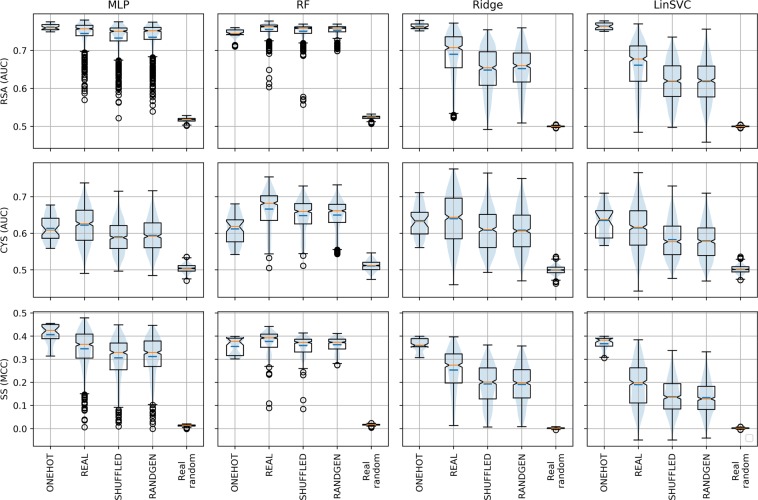
Figure 1.
Results of the randomization experiments. This figure shows the results of the experiments on the 3 tasks tested in this study (Cysteine oxidation (CYS), Relative Solvent Accessibility (RSA) and Secondary Structure (SS) predictions). The plots show the performances obtained by 4 ML methods (Multilayer Perceptron (MLP), Random Forest (RF), Ridge classifier (Ridge) and Linear Support Vector Machine (LinSVC)) in terms of their AUC (MCC in the SS case). For each ML method and each task we ran five simulations, testing the scores obtained with different features encoding. For each combination of task and ML method, we tested the ONEHOT encoding (ONEHOT), randomly sampled propensity scales (REAL), randomly shuffled propensity scales (SHUFFLED), randomly generated scales (RANDGEN) and a true randomization of the vectors (see Methods for more details).

