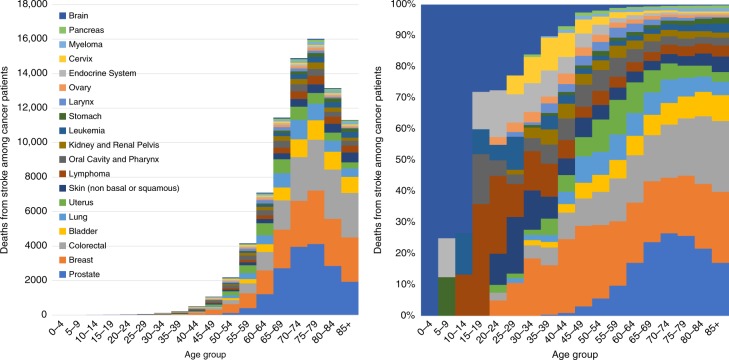
Fig. 3.
Fatal stroke among cancer patients as a function of age group. a The y-axis depicts the absolute number of strokes and the x-axis depicts the age group at time of diagnosis. The colors depict the disease sites. The majority of strokes are in patients diagnosed at an older age (i.e., 40–90-year-olds), and the plurality of strokes s occurs in patients diagnosed with prostate, breast, and colorectal cancer. b The y-axis depicts the relative number of strokes compared to all cancer patients, and the x-axis depicts the age group at time of diagnosis. The colors depict the disease sites. For children, adolescents, and young adults (i.e., <40 years old), the plurality of strokes is seen in brain tumor patients. In contrast, among older adults (i.e., >40 years old) the plurality of strokes occurs in patients with cancer of the prostate, breast, and colorectal cancer. Source data are provided as a Source Data file

