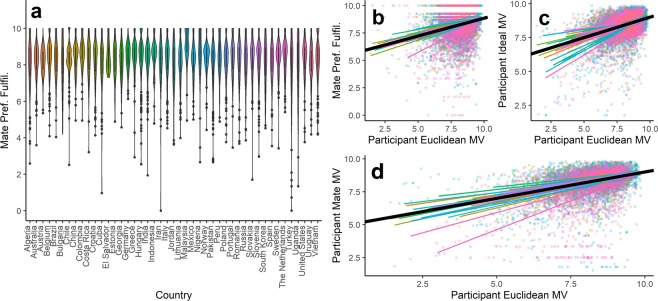
Figure 2.
The pattern of mate choice effects from the cross-cultural human sample. Participants across cultures strongly fulfill their mate preferences across countries (a). Higher mate value participants furthermore more strongly fulfill their preferences (b), set higher mate value ideals (c), and tend to be paired with higher mate value partners (d). Colored lines represent trend lines for different countries; dots represent individual participants; the black line represents the overall trend across all countries.

