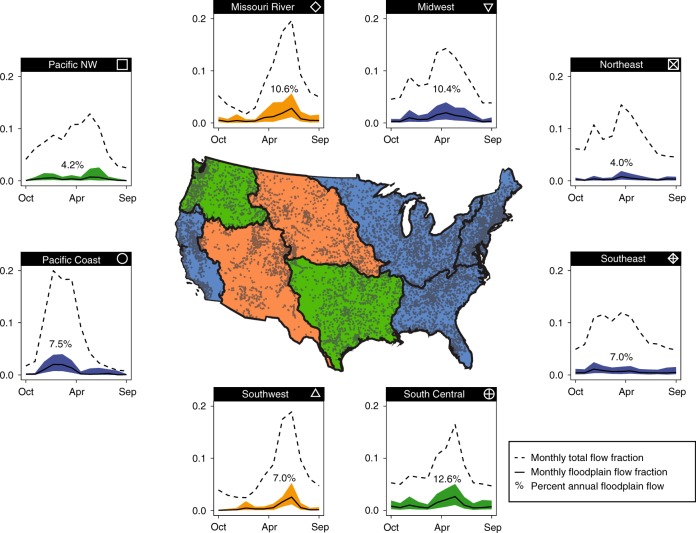
Fig. 1.
Timing of annual stream flow and inundation. (outside) Regional variation across major river basins of the mean monthly proportion of total annual river flow (dotted line) and mean monthly proportion of floodplain flow to total annual river flow. The highlighted number for each basin represents the percent of total annual river flow on floodplains. The shading represents the 25th and 75th quantiles based on analysis of all gage stations within each basin. (inside) Gage stations and basin boundaries (Northeast; Southeast; Midwest; South Central; Missouri; Southwest; Pacific Northwest; Pacific Coast) are displayed, and the background color (blue, orange, and green) indicates the hydroclimatic signature (rain dominated = blue; snow dominated = orange; and mixed = green)

