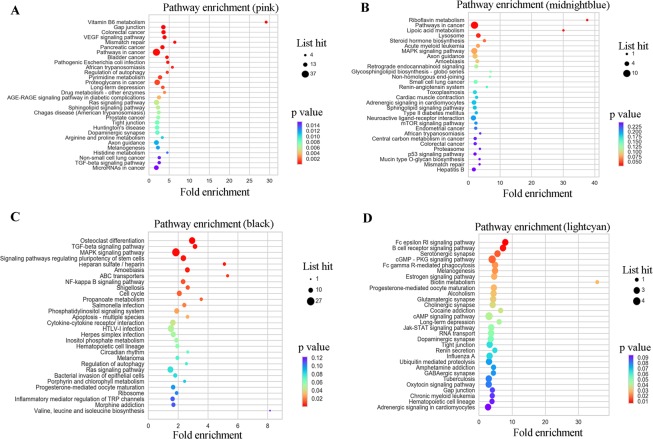
Figure 4.
KEGG pathway enrichment analysis of core genes in different modules. (A) KEGG pathway enrichment analysis of core genes in pink module. (B) KEGG pathway enrichment analysis of core genes in midnight blue module. (C) KEGG pathway enrichment analysis of core genes in black module. (D) KEGG pathway enrichment analysis of core genes in light cyan module. The size of the ball represents the number of genes enriched in each term. The color of the ball represents the number of the P value.

