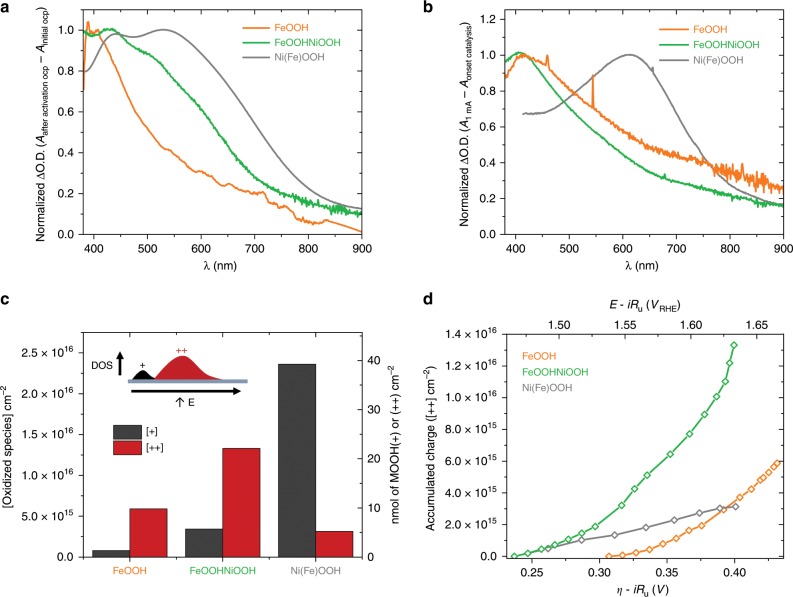
Fig. 2.
Accumulated (+) and (++) species for each electrocatalyst. a Normalised ΔO.D. spectra (to 1 at peak ΔO.D.) for the first (0/+), precatalytic, oxidation of FeOOH (orange), FeOOHNiOOH (green) and Ni(Fe)OOH (grey), obtained from the difference between the spectra at open circuit potential (OCP) after and before activation. b Normalised ΔO.D. spectra for the (+/++) oxidation wave correlated with water oxidation for FeOOH (orange), FeOOHNiOOH (green) and Ni(Fe)OOH (grey), obtained by subtracting spectra at OCP after activation from the spectra at 1 mA cm−2 of current density. c Concentrations of oxidised MOOH(+) states generated in the activation process (black) and of MOOH(++) states generated at a current density of 1 mA cm−2 (red) for each electrocatalyst. Inset: schematic representation of the corresponding densities of states (DOS) for these electrocatalysts. d Accumulated concentrations of MOOH(++) states vs. the applied overpotential (empty diamonds, solid lines). For both graphs FeOOH (orange), FeOOHNiOOH (green) and Ni(Fe)OOH (grey)

