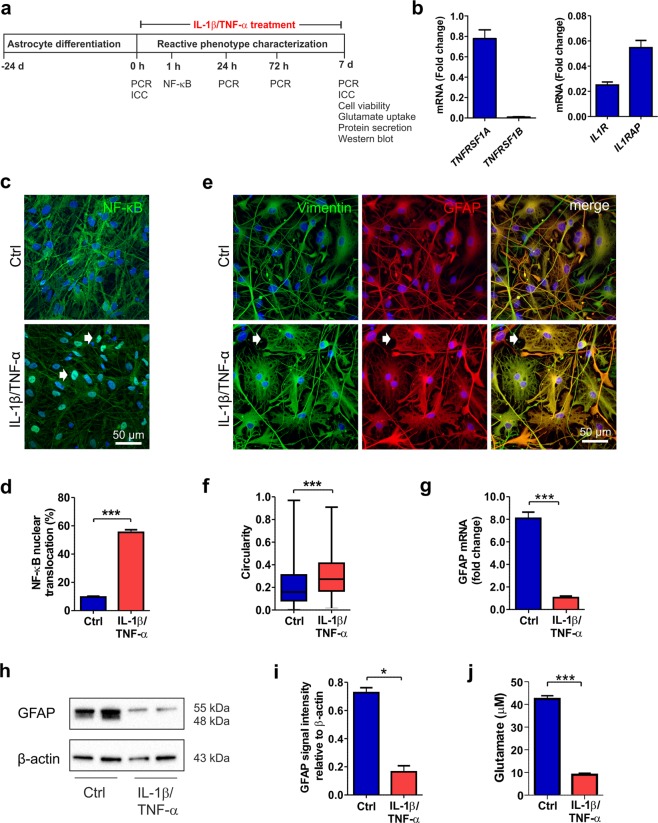
Figure 2.
IL-1β and TNF-α treatment induces a reactive astrocyte phenotype. (a) Experimental setup for astrocyte stimulation with IL-1β and TNF-α and astrocyte characterization. (b) Gene expression analysis revealed the presence of TNFRSF1A, IL1R, and IL1RAP transcripts in the astrocytes (n = 2 with three technical replicates; the data are representative of two experiments). (c) In control astrocytes, NF-κB was ubiquitously expressed in the cytoplasm, whereas after 60 minutes cytokine stimulation, it was activated and translocated to the nucleus (white arrows). (d) NF-κB activation was quantified as the percentage of nuclei with translocation among the total nuclei (n = 6 cultures; the data were analyzed from two experiments). (e) Immunocytochemical staining of the intermediate filament proteins vimentin and GFAP showed morphological changes from filamentous to flattened shapes (white arrows) in response to cytokine stimulation. (f) Morphological change was quantified based on the vimentin staining of samples on day 7. The circularity of the cells in each group is presented as the median and interquartile range, with the whiskers showing the minimum and maximum values. Images were analyzed from six cultures derived from three experiments. (g) GFAP expression levels decreased following cytokine stimulation (n = 2 with three technical replicates; the data are representative of two experiments). (h) GFAP was analyzed at the protein level by western blot analysis, representative cropped images of the membranes for the GFAP and β-Actin are shown here and full length of membranes are presented in the Supplementary Fig. S4. (i) Quantification of GFAP and β-Actin showed a reduction after cytokine treatment. β-Actin was used as a loading control (n = 2; the data are representative of three experiments). (j) Cytokine treatment impaired the glutamate uptake capacity of astrocytes (n = 3; the data are representative of two experiments). The data are presented as the mean ± s.e.m. Statistical analysis was performed with independent-sample t-tests except in (f), in which statistical analysis was performed with the Mann-Whitney U test. Statistical significance: * p < 0.05, ** p < 0.01, and *** p < 0.001.

