Figure 4.
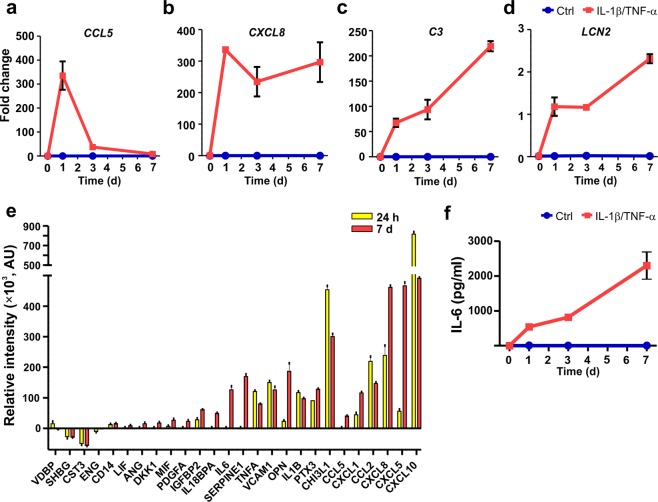
Cytokine treatment results in the inflammatory activation of astrocytes. (a–d) The gene expression levels of (a) CCL5, (b) CXCL8, (c) C3, and (d) LCN2 were analyzed in cytokine-treated and control astrocytes at the 0-, 1-, 3- and 7-day time points. Robust increases in the expression of all studied genes were detected after cytokine treatment (n = 2 with three technical replicates; the data are representative of two experiments). (e) Secretion of inflammatory factors into the medium was analyzed at the 24 h and 7-day time points. The relative intensity values for the different analytes were calculated by subtracting the intensity values of the control samples from those of the cytokine-treated samples at each time point (n = 1 with two technical replicates; the data are representative of two experiments). (f) The levels of IL-6 were analyzed at 0, 1, 3 and 7 day in cytokine-treated and control astrocytes. IL-6 levels increased in a time-dependent manner over 7 days in the cytokine-treated samples, while under control conditions, the levels were undetectable (n = 2 with two technical replicates; the data are representative of two experiments). The quantification data are presented as the mean ± s.e.m.

