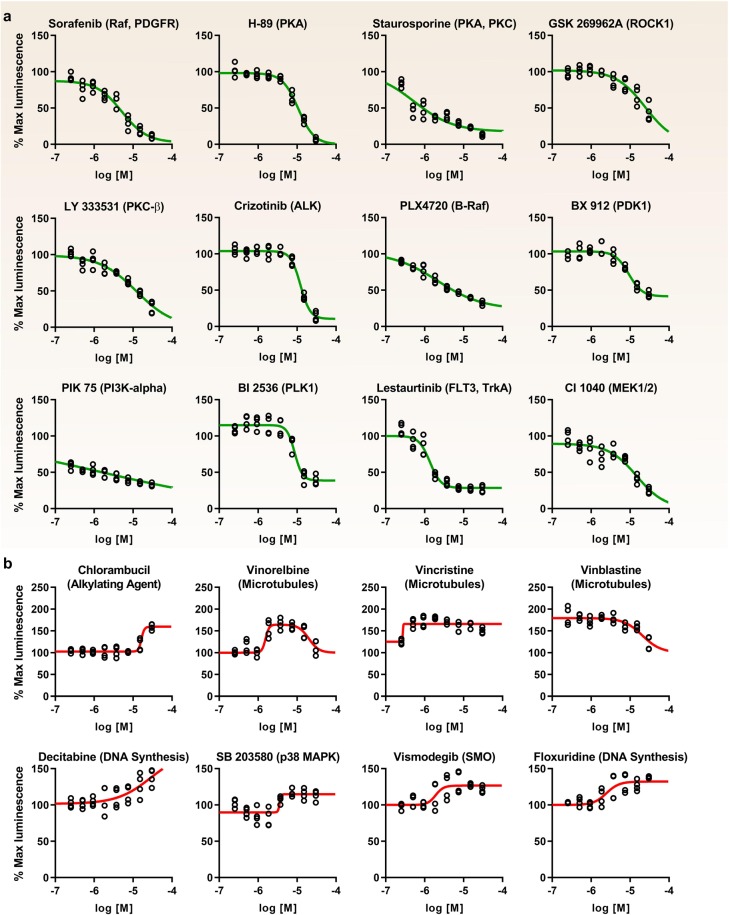
Figure 5.
Initial dose-response validation of identified HTS hits. Graphs showing percent maximal luminescence from treated Clone V cells (normalized to DMSO controls) versus compound concentration with nonlinear regression curve fitting using Graphpad Prism 8. (a) Antagonists and (b) agonists are listed in order of efficacy as determined in the primary screening. Antagonists were defined as those compounds that inhibit FGF14:Nav1.6 complementation with increasing dose, while agonists were defined as those compounds which increase FGF14:Nav1.6 complementation with increasing dose. Estimated IC50 and EC50 values are provided in Table 2. Doses range from 0.25 µM–30 µM and were tested under identical conditions as the primary screening (n = 4 per concentration divided over two 384-well plates).

