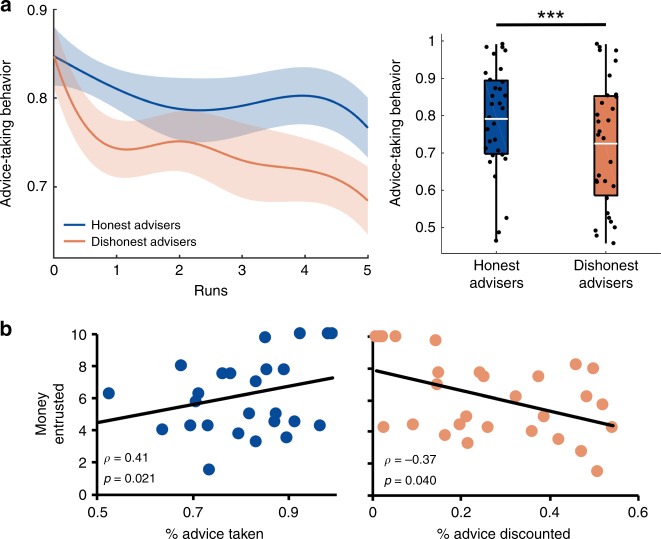
Fig. 2.
Behavioral results. a Trusting behavior in the take advice game over runs (left) and on average (right) toward honest and dishonest advisers. On average, participants took significantly more advice from the honest than the dishonest adviser (t test). Data points on the left were interpolated for visualization purposes and shadowed areas represent standard errors. White lines in the box-plots on the right represent average advice-taking behavior across participants. Each black dot represents one participant. b Amount of money entrusted in the trust game with honest (left) and dishonest (right) others correlated with participants’ willingness to take advice from the advisers (Spearman’s correlations). Each dot represents one participant. ***P < 0.001

