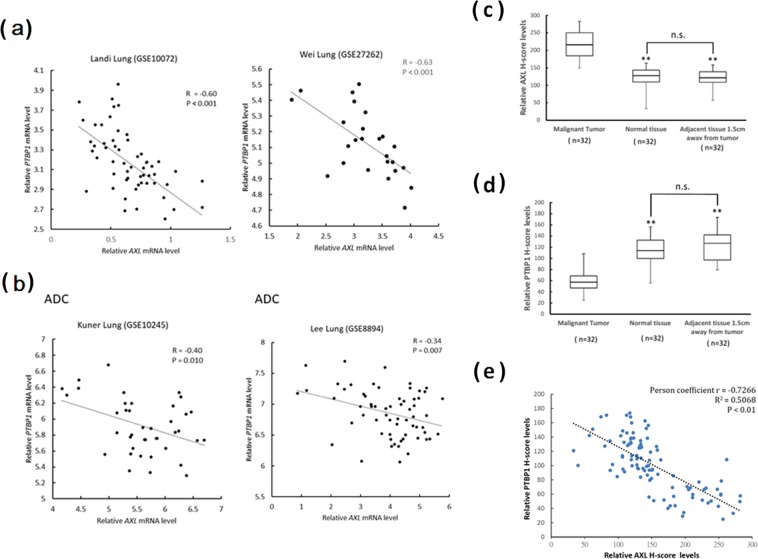
Figure 7.
Expression levels of AXL and PTBP1 in lung tissues and tumors. Inverse correlation between expression levels of AXL and PTBP1 in both normal vs. tumor (A) and normal vs. adenocarcinoma (B) in Oncomine datasets. Graphs displaying the comparisons between the H-scores of AXL (C) and PTBP1 (D) with respect to benign (normal and adjacent tissues) and lung cancer tissues were presented. In comparison to normal tissues, the mean H-scores for AXL were significantly higher in lung cancer tissues and the mean H-scores for PTBP1 were significantly lower (*P < 0.01). (E) Negative correlation between AXL and PTBP1 expression. **P < 0.01.

