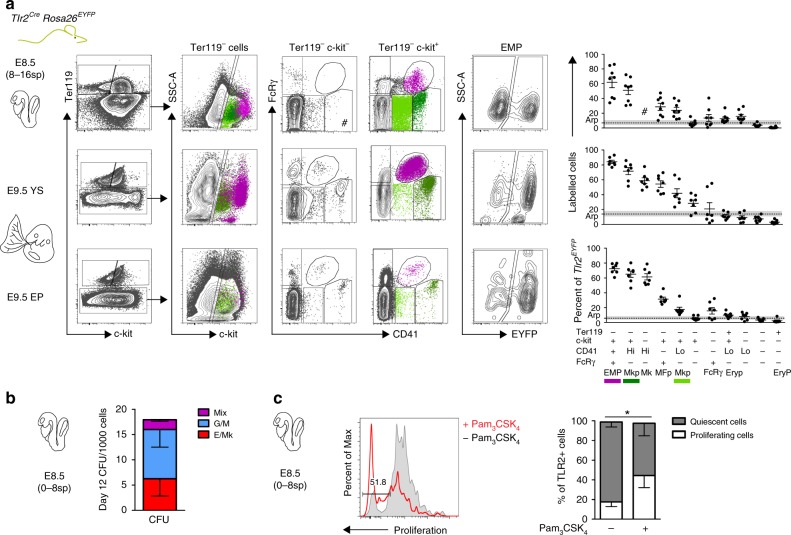
Fig. 3.
Lineage tracing shows activation of Tlr2 locus predominantly in EMPs. a Embryonic hematopoietic precursors were analyzed by FCM for frequency of labeling in E8.5 and E9.5 Tlr2CreRosa26EYFP embryos (mean ± SEM; n = 7–9; arp, average recombination probability is equal to mean ± SEM (gray zone) labeling efficiency of all live cells; EMP, erythro-myeloid progenitor; Mkp, megakaryocyte progenitor; Mk, megakaryocyte; MFp, macrophage progenitor; FcRγ, FcRγ+ cells; Eryp, Ery progenitor; EryP, primitive erythrocyte; # insufficient cell count for statistical analysis). b Sorted E8.5 Tlr2CreEYFP+Lin− cells (see Supplementary Fig. 4g) were plated in a methylcellulose medium and assessed for their differentiation potential at day 12 of culture (mean ± SEM; n = 8). c The proliferation history of sorted Tlr2CreEYFP+Lin– cells cultured in the presence (red open histogram) or absence (gray closed histogram) of Pam3CSK4 (1 µg/ml) on ST-2 stroma was assessed by the dilution of proliferation dye in TLR2+ cells after 72 h (mean ± SEM; n = 3; *p < 0.05; paired, one-tailed t test). Source data are provided as a Source Data file

