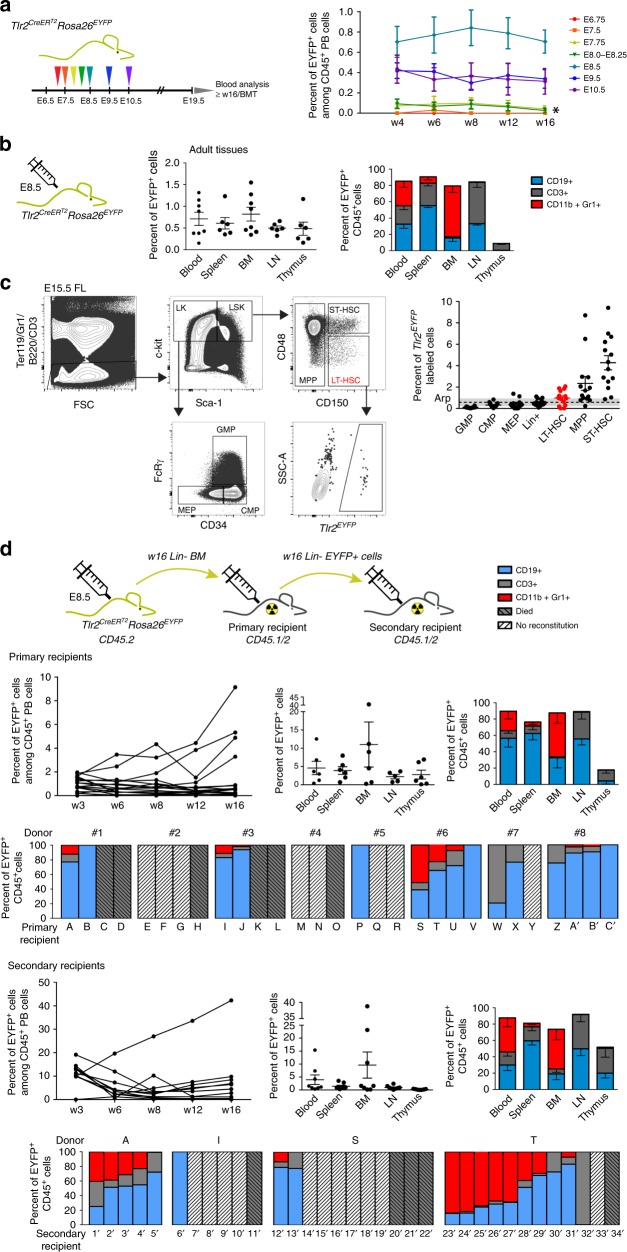
Fig. 7.
Progenitors with active Tlr2 locus labeled at E8.5 contribute to adult hematopoiesis. a Tlr2CreERT2Rosa26EYFP embryos pulsed with a single dose of 4-OHT between E6.75-E10.5 were monitored postpartum for the presence of Tlr2CreERT2EYFP+ cells in their peripheral blood (PB) up to 16 weeks of age (mean ± SEM; n = 9–25; * indicates short-term hematopoietic potential which persisted for only the first 4 weeks of life. b Percentage of Tlr2CreERT2EYFP+ cells, labeled at E8.5, and their contribution to the main CD45+ lineages in different hematopoietic organs is shown (mean ± SEM; n = 5–7; see gating strategy in Supplementary Fig. 8a). c Tlr2CreERT2Rosa26EYFP embryos were pulsed with a single dose of 4-OHT at E8.5, and labeling efficiency of indicated hematopoietic populations was analyzed in E15.5 FL by FCM. LT-HSC gate is shown as an example. d Tlr2CreERT2Rosa26EYFP embryos were pulsed with a single dose of 4-OHT at E8.5. At 16 weeks of age, Lin-depleted BM (CD45.2) (w16 Lin– BM; see Supplementary Fig. 8b) was transferred to lethally irradiated primary recipients (CD45.1/2) along with support BM cells (0.5 × 10⁶ CD45.1), and the level of Tlr2CreERT2EYFP+ cells was monitored in PB of primary recipients until week 16 (upper left panel). The percentage of Tlr2CreERT2EYFP+ cells, their organ distribution and fate in primary recipients is shown (mean ± SEM; n = 6). Bar graphs show the reconstitution success and fate of Tlr2CreERT2EYFP+ cells in primary recipients (A–C’) of BM from eight individual donors (#1–8). Sorted Tlr2CreERT2EYFP+ cells (see Supplementary Fig. 8c) from Lin-depleted BM of 16-week old primary recipients were transferred to secondary, lethally irradiated recipients (CD45.1/2) along with support BM cells (0.5 × 10⁶, CD45.1) and the frequency of Tlr2CreERT2EYFP+ cells in PB was monitored until week 16 (the outcome of BMT from one primary recipient (donor T) is shown (secondary recipients, upper row, left panel). The percentage of Tlr2CreERT2EYFP+ cells, their organ distribution and fate in secondary recipients is shown (mean ± SEM; n = 8). Bar graphs on the bottom indicate the reconstitution success and fate of Tlr2CreERT2EYFP+ cells in secondary recipients (1´−34´) of BM from four primary recipients. Source data are provided as a Source Data file

