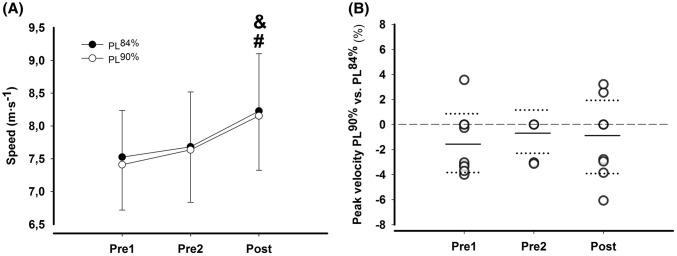
Fig. 1.
a Peak velocity at Pre1, Pre2, and Post for PLs of 84 and 90% of body height. Data are presented as mean ± SD. b Individual differences (%) in peak velocity at Pre1, Pre2, and Post between PL of 84 and 90% of body height. Horizontal full lines indicate mean differences, and horizontal dotted lines show upper and lower 95% CI. &Difference to Pre2, #difference to Pre1 (P < 0.05)

