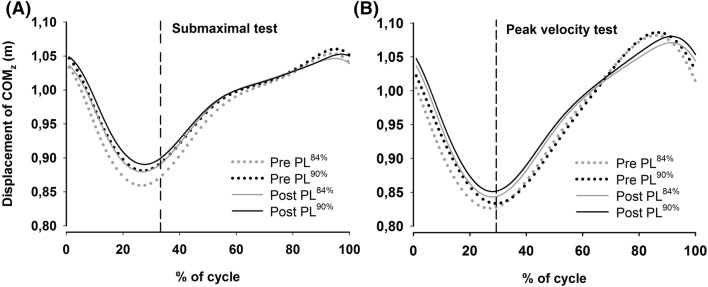
Fig. 3.
Vertical displacement of center of mass (COMz) during a full cycle at submaximal test (4.5 [females] or 6 m s−1 [males]) and at peak velocity test (7.3 ± 0.7 m s−1) at Pre2 and Post for PL84% and PL90%. Each curve represents an average of five cycles for each subject. The cycle starts (0%) and ends (100%) at pole plant. Vertical dotted line indicates pole lift-off

