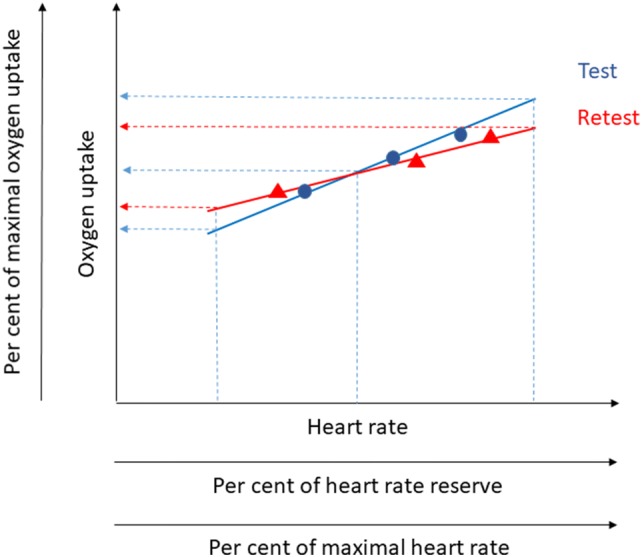
Fig. 1.

An illustration of how a variability in HR–VO2 relations at test and retest can affect measures of reproducibility. Linear relations from regression equations, based on values from three submaximal work rates at test and retest, are illustrated as unbroken lines. Based on different HR and the regression equations, the estimated levels of VO2 can be higher, equal or lower at test compared to retest (see broken lines)
